$659,000Asking Price
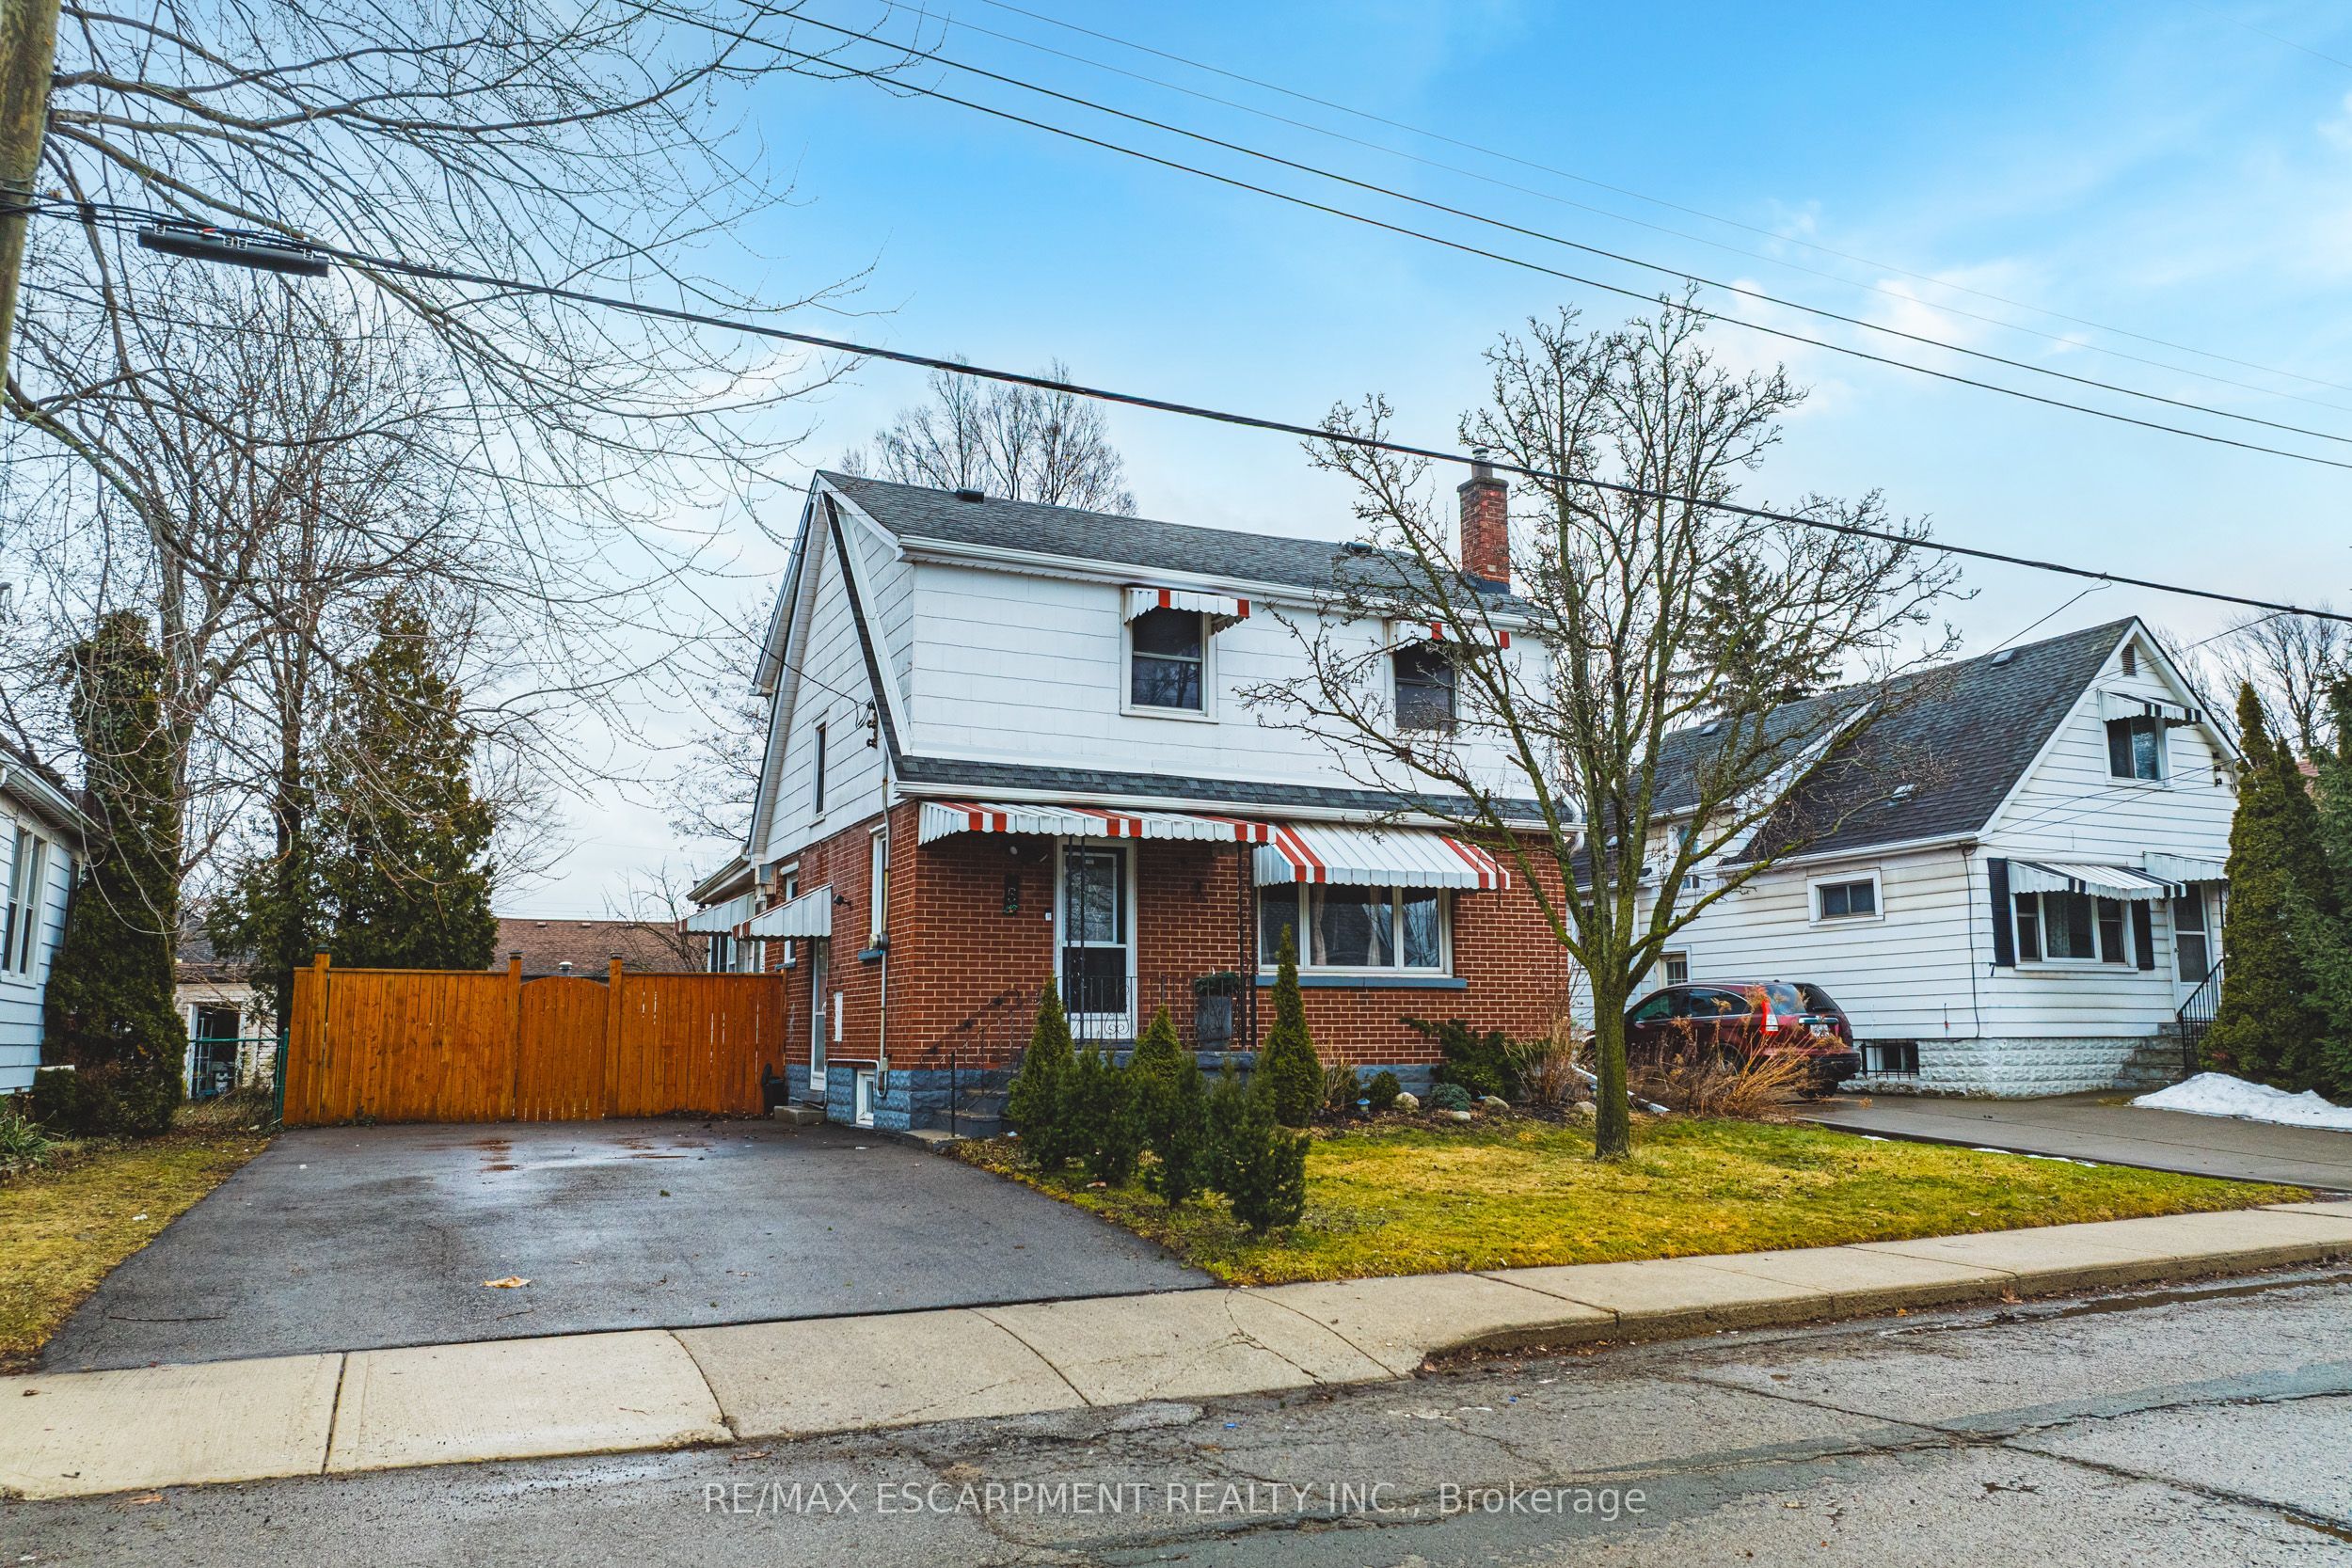
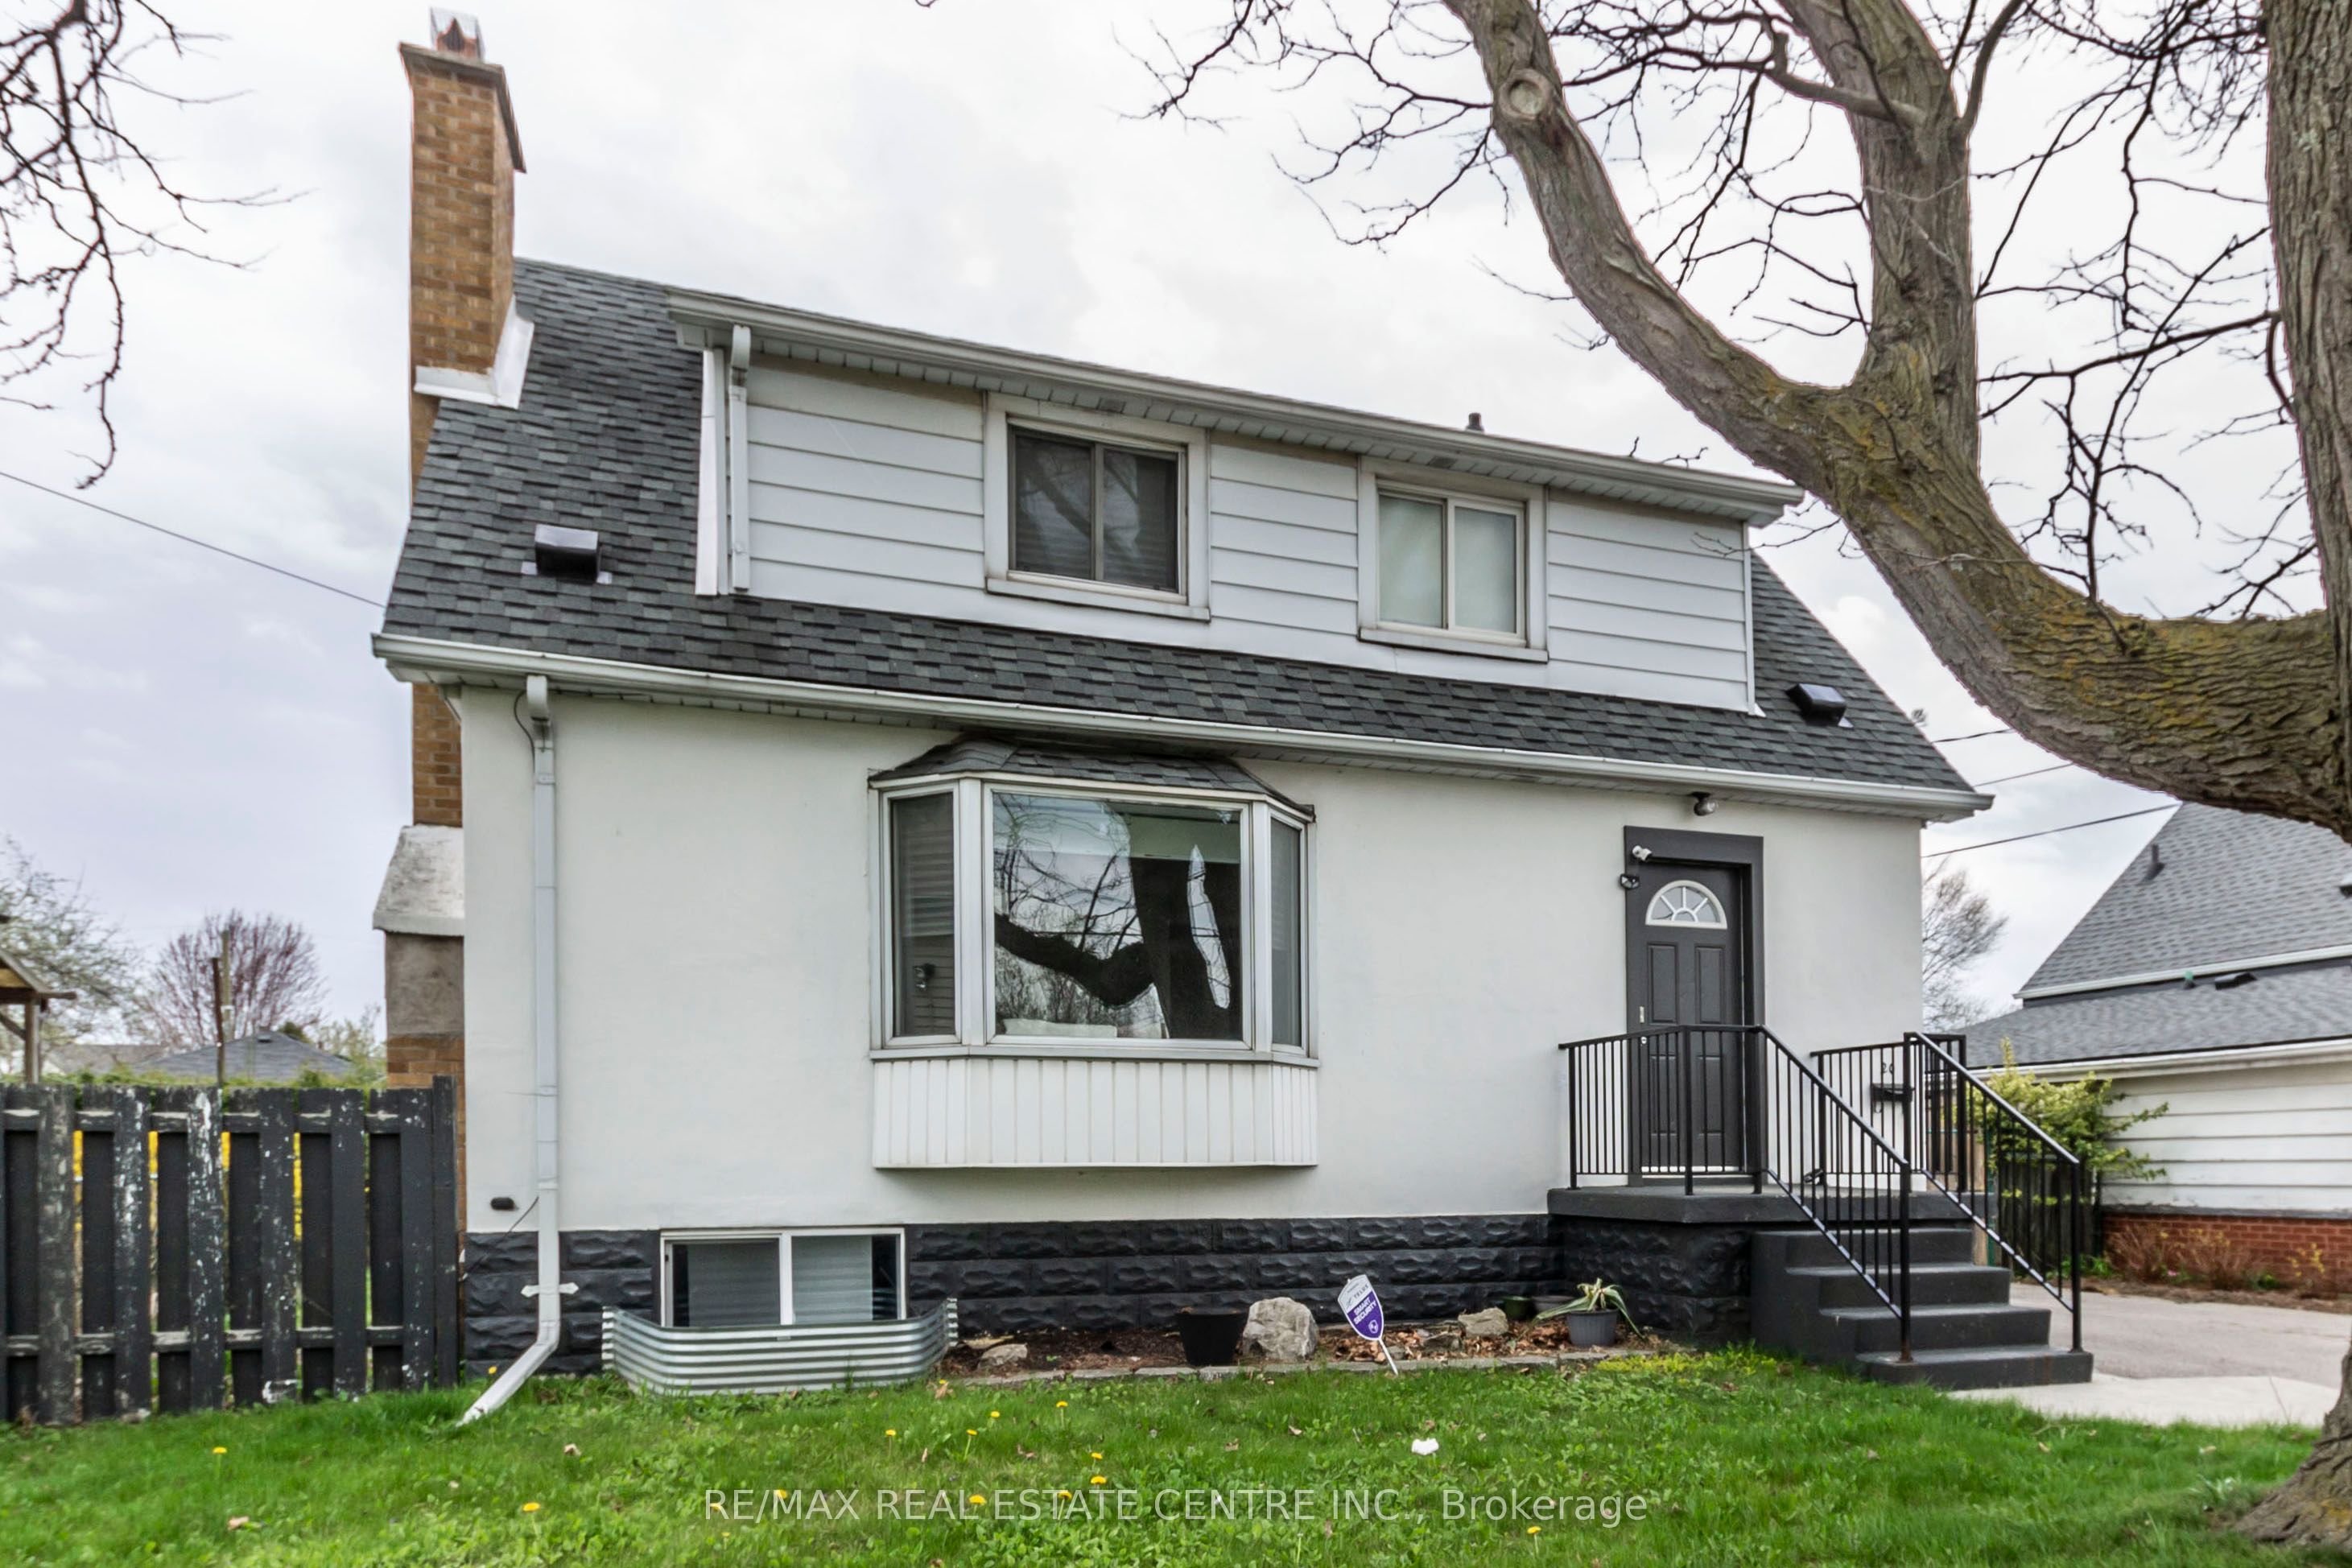
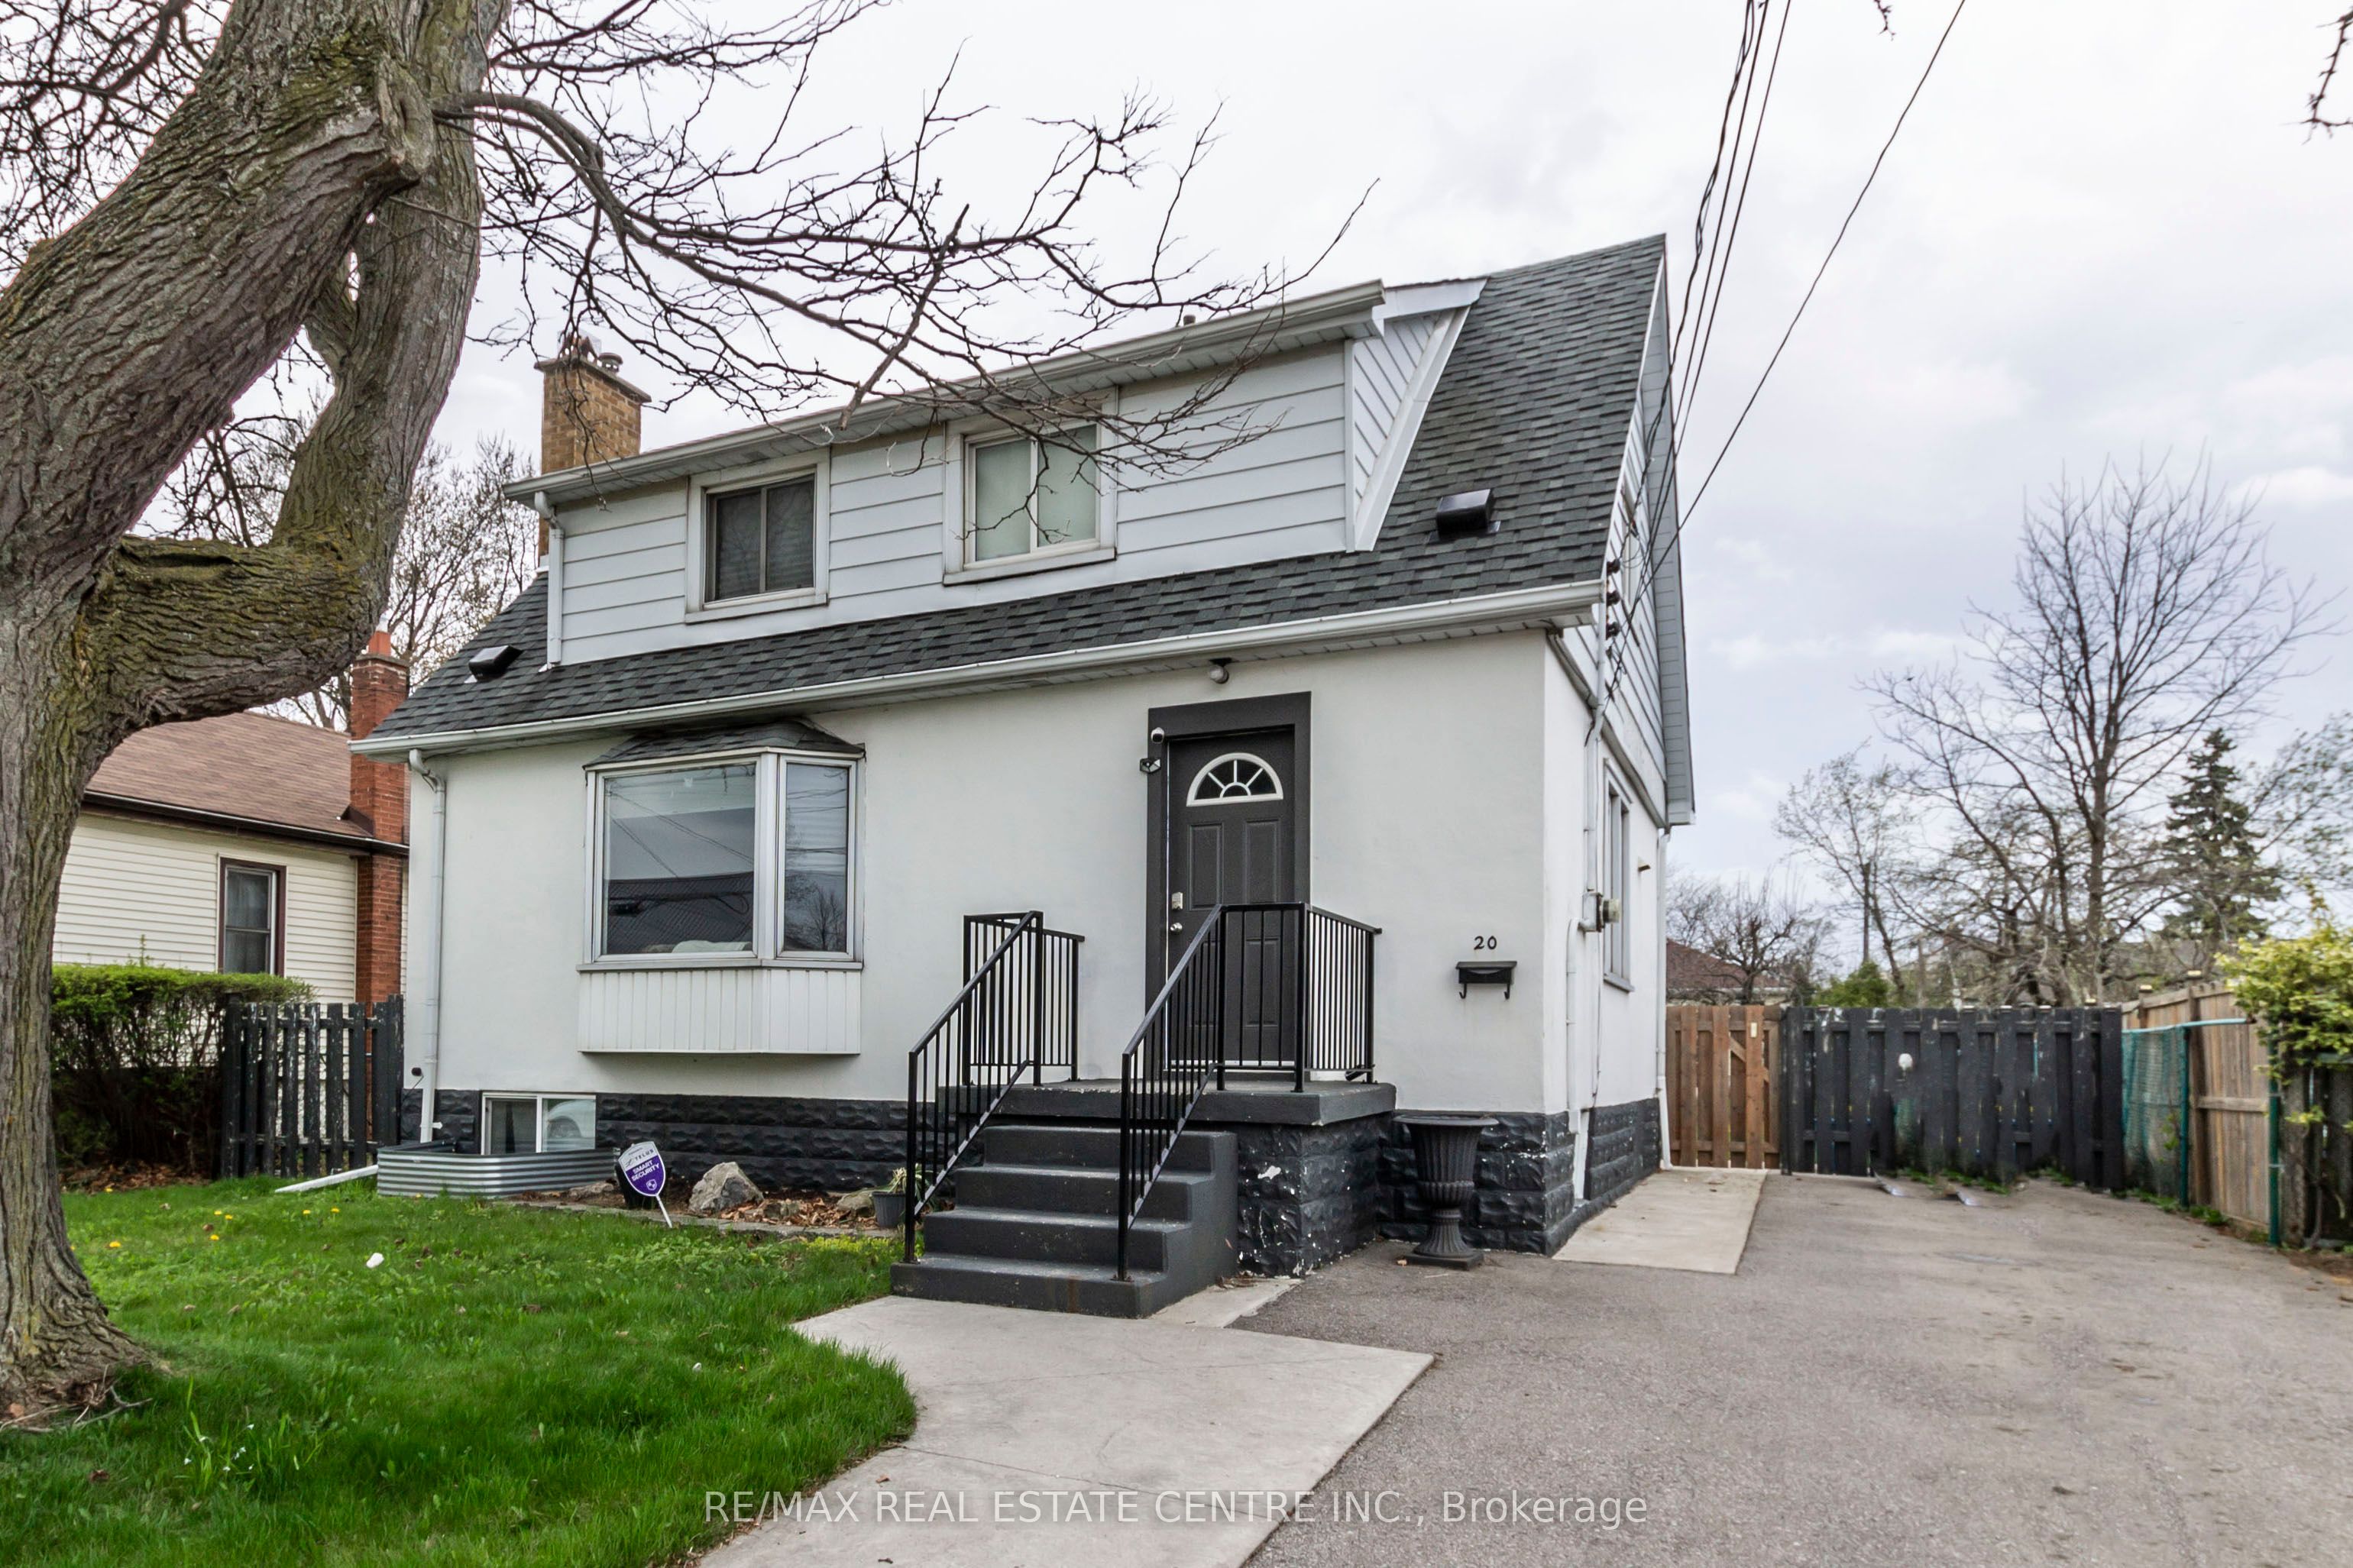
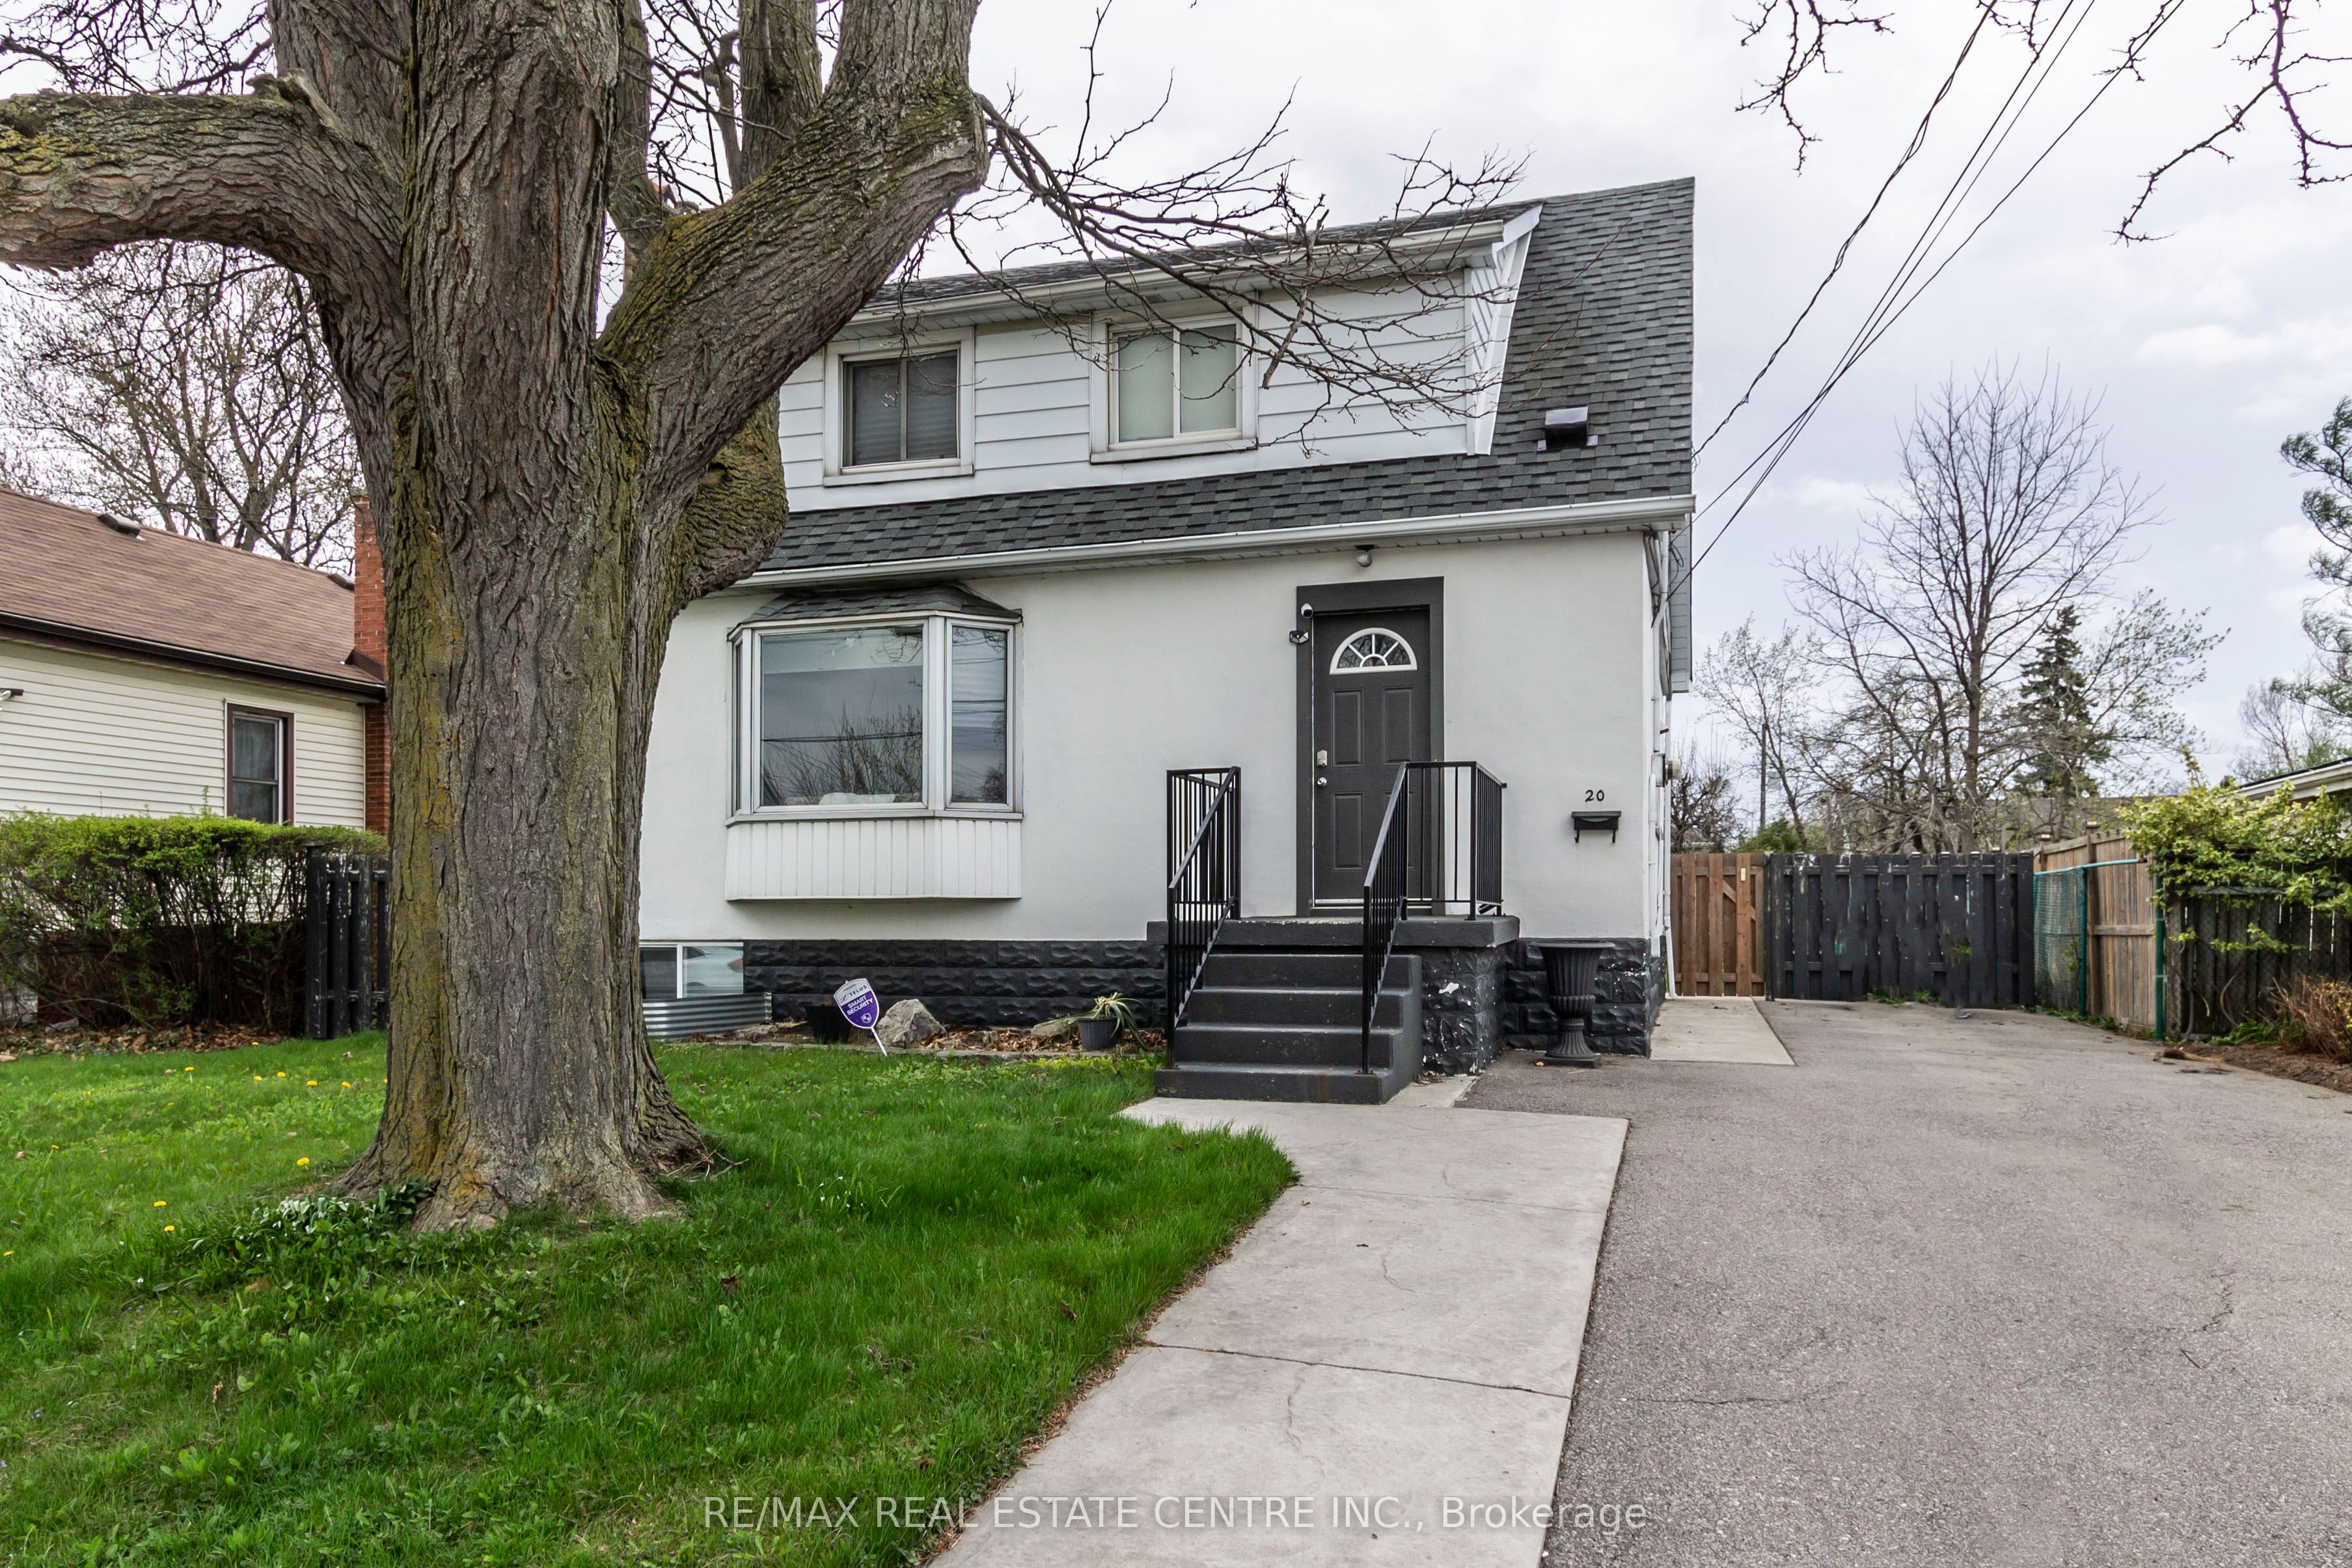
20 West 1st Street, Hamilton, ON L9C 3B8
Bonnington, Hamilton
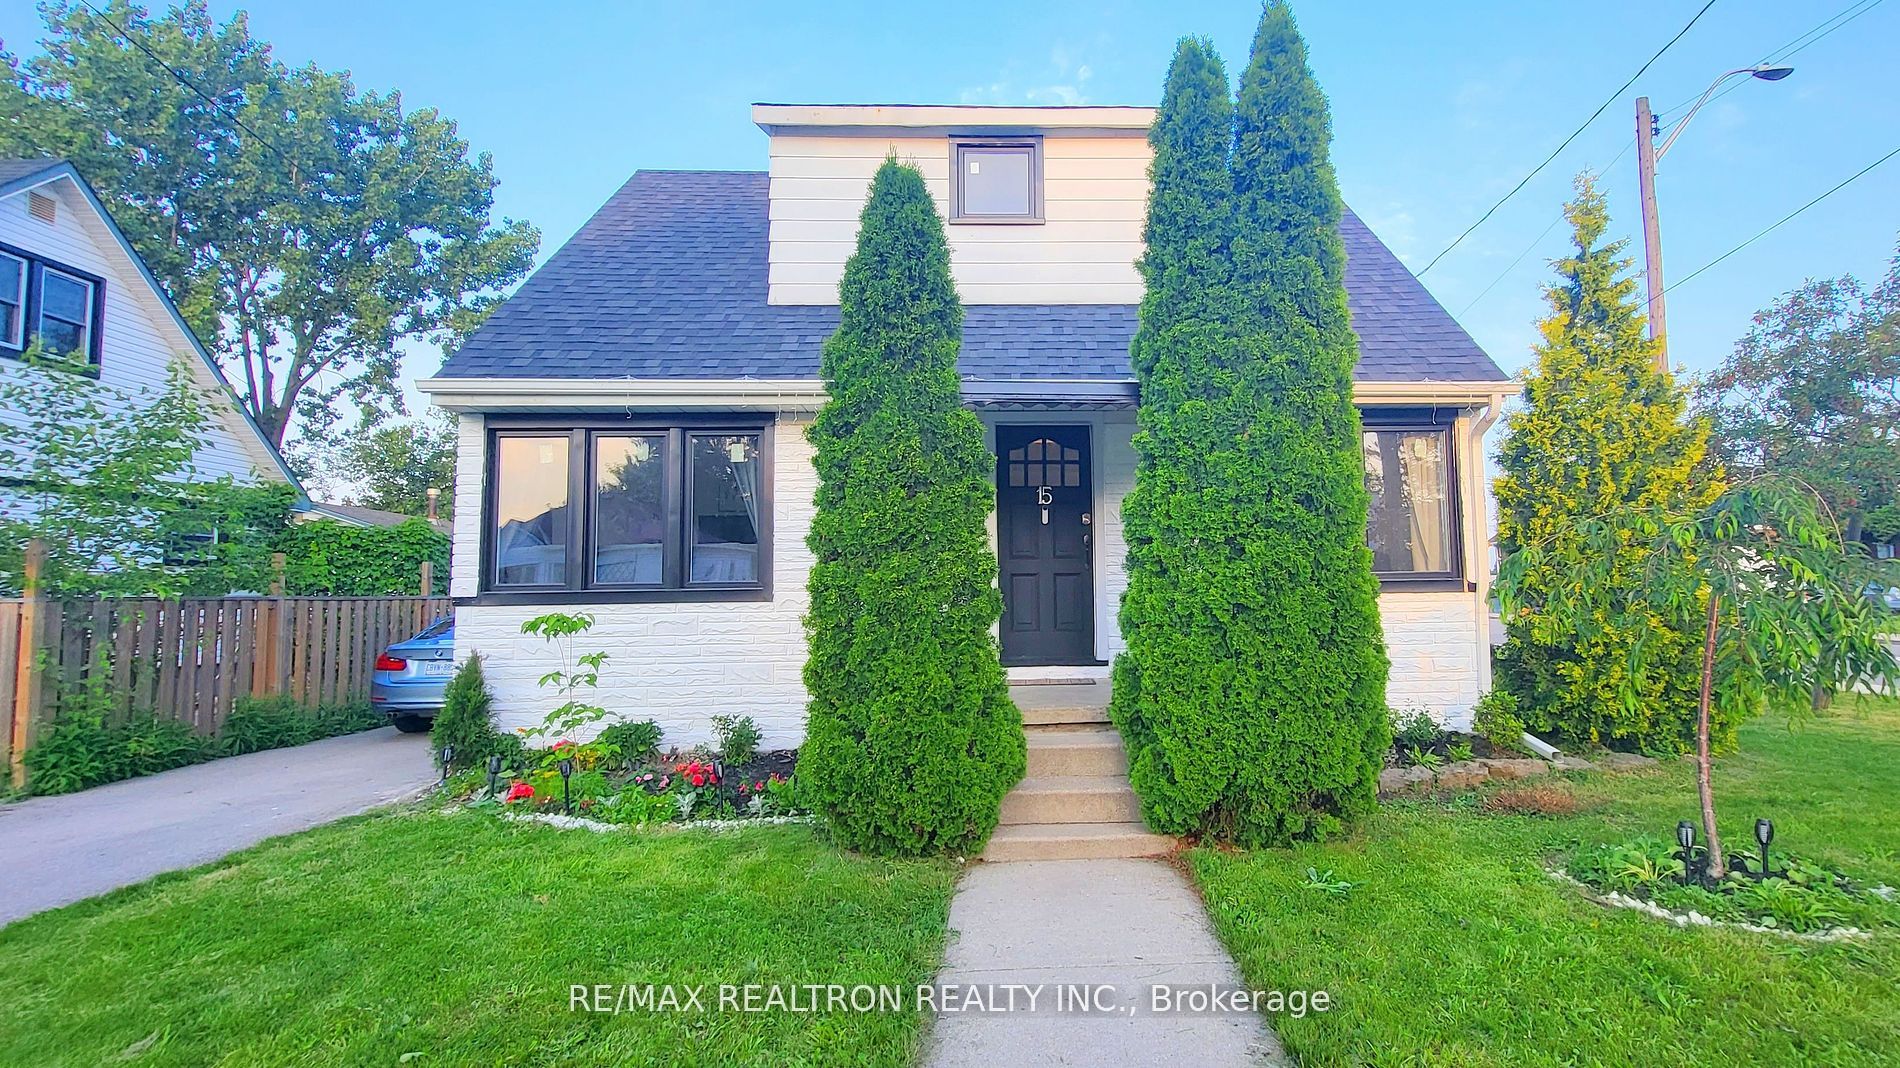
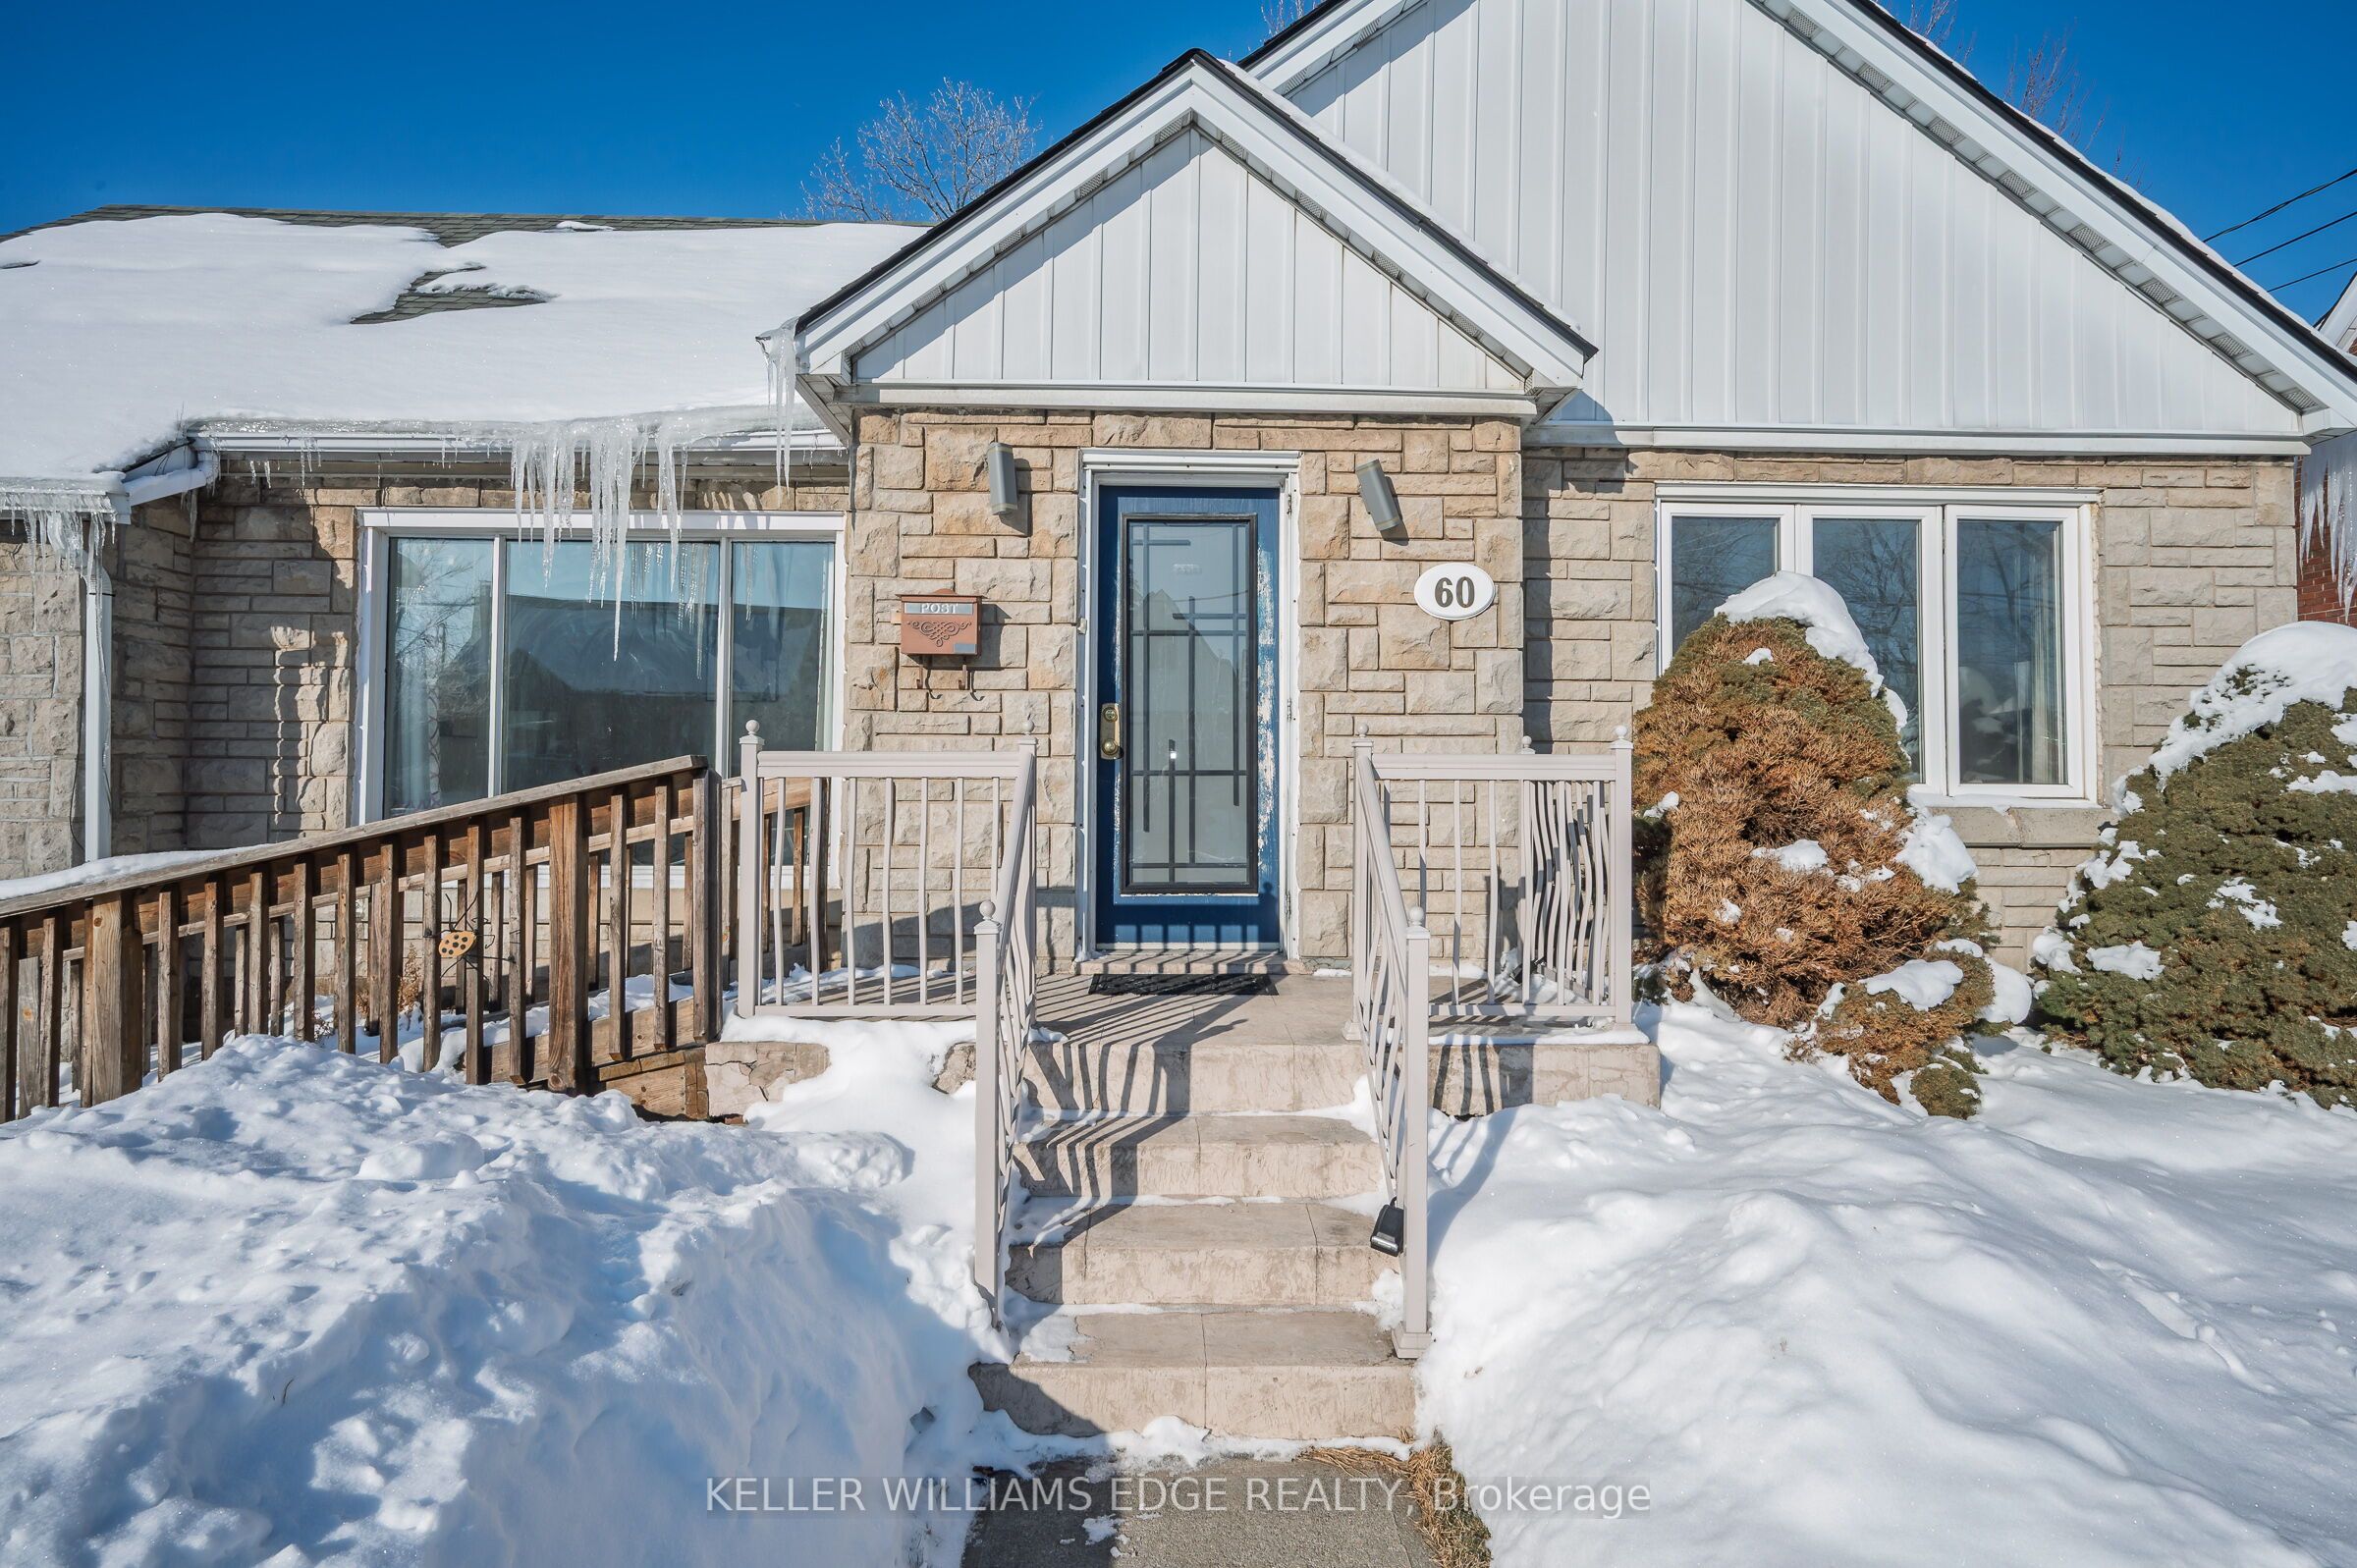
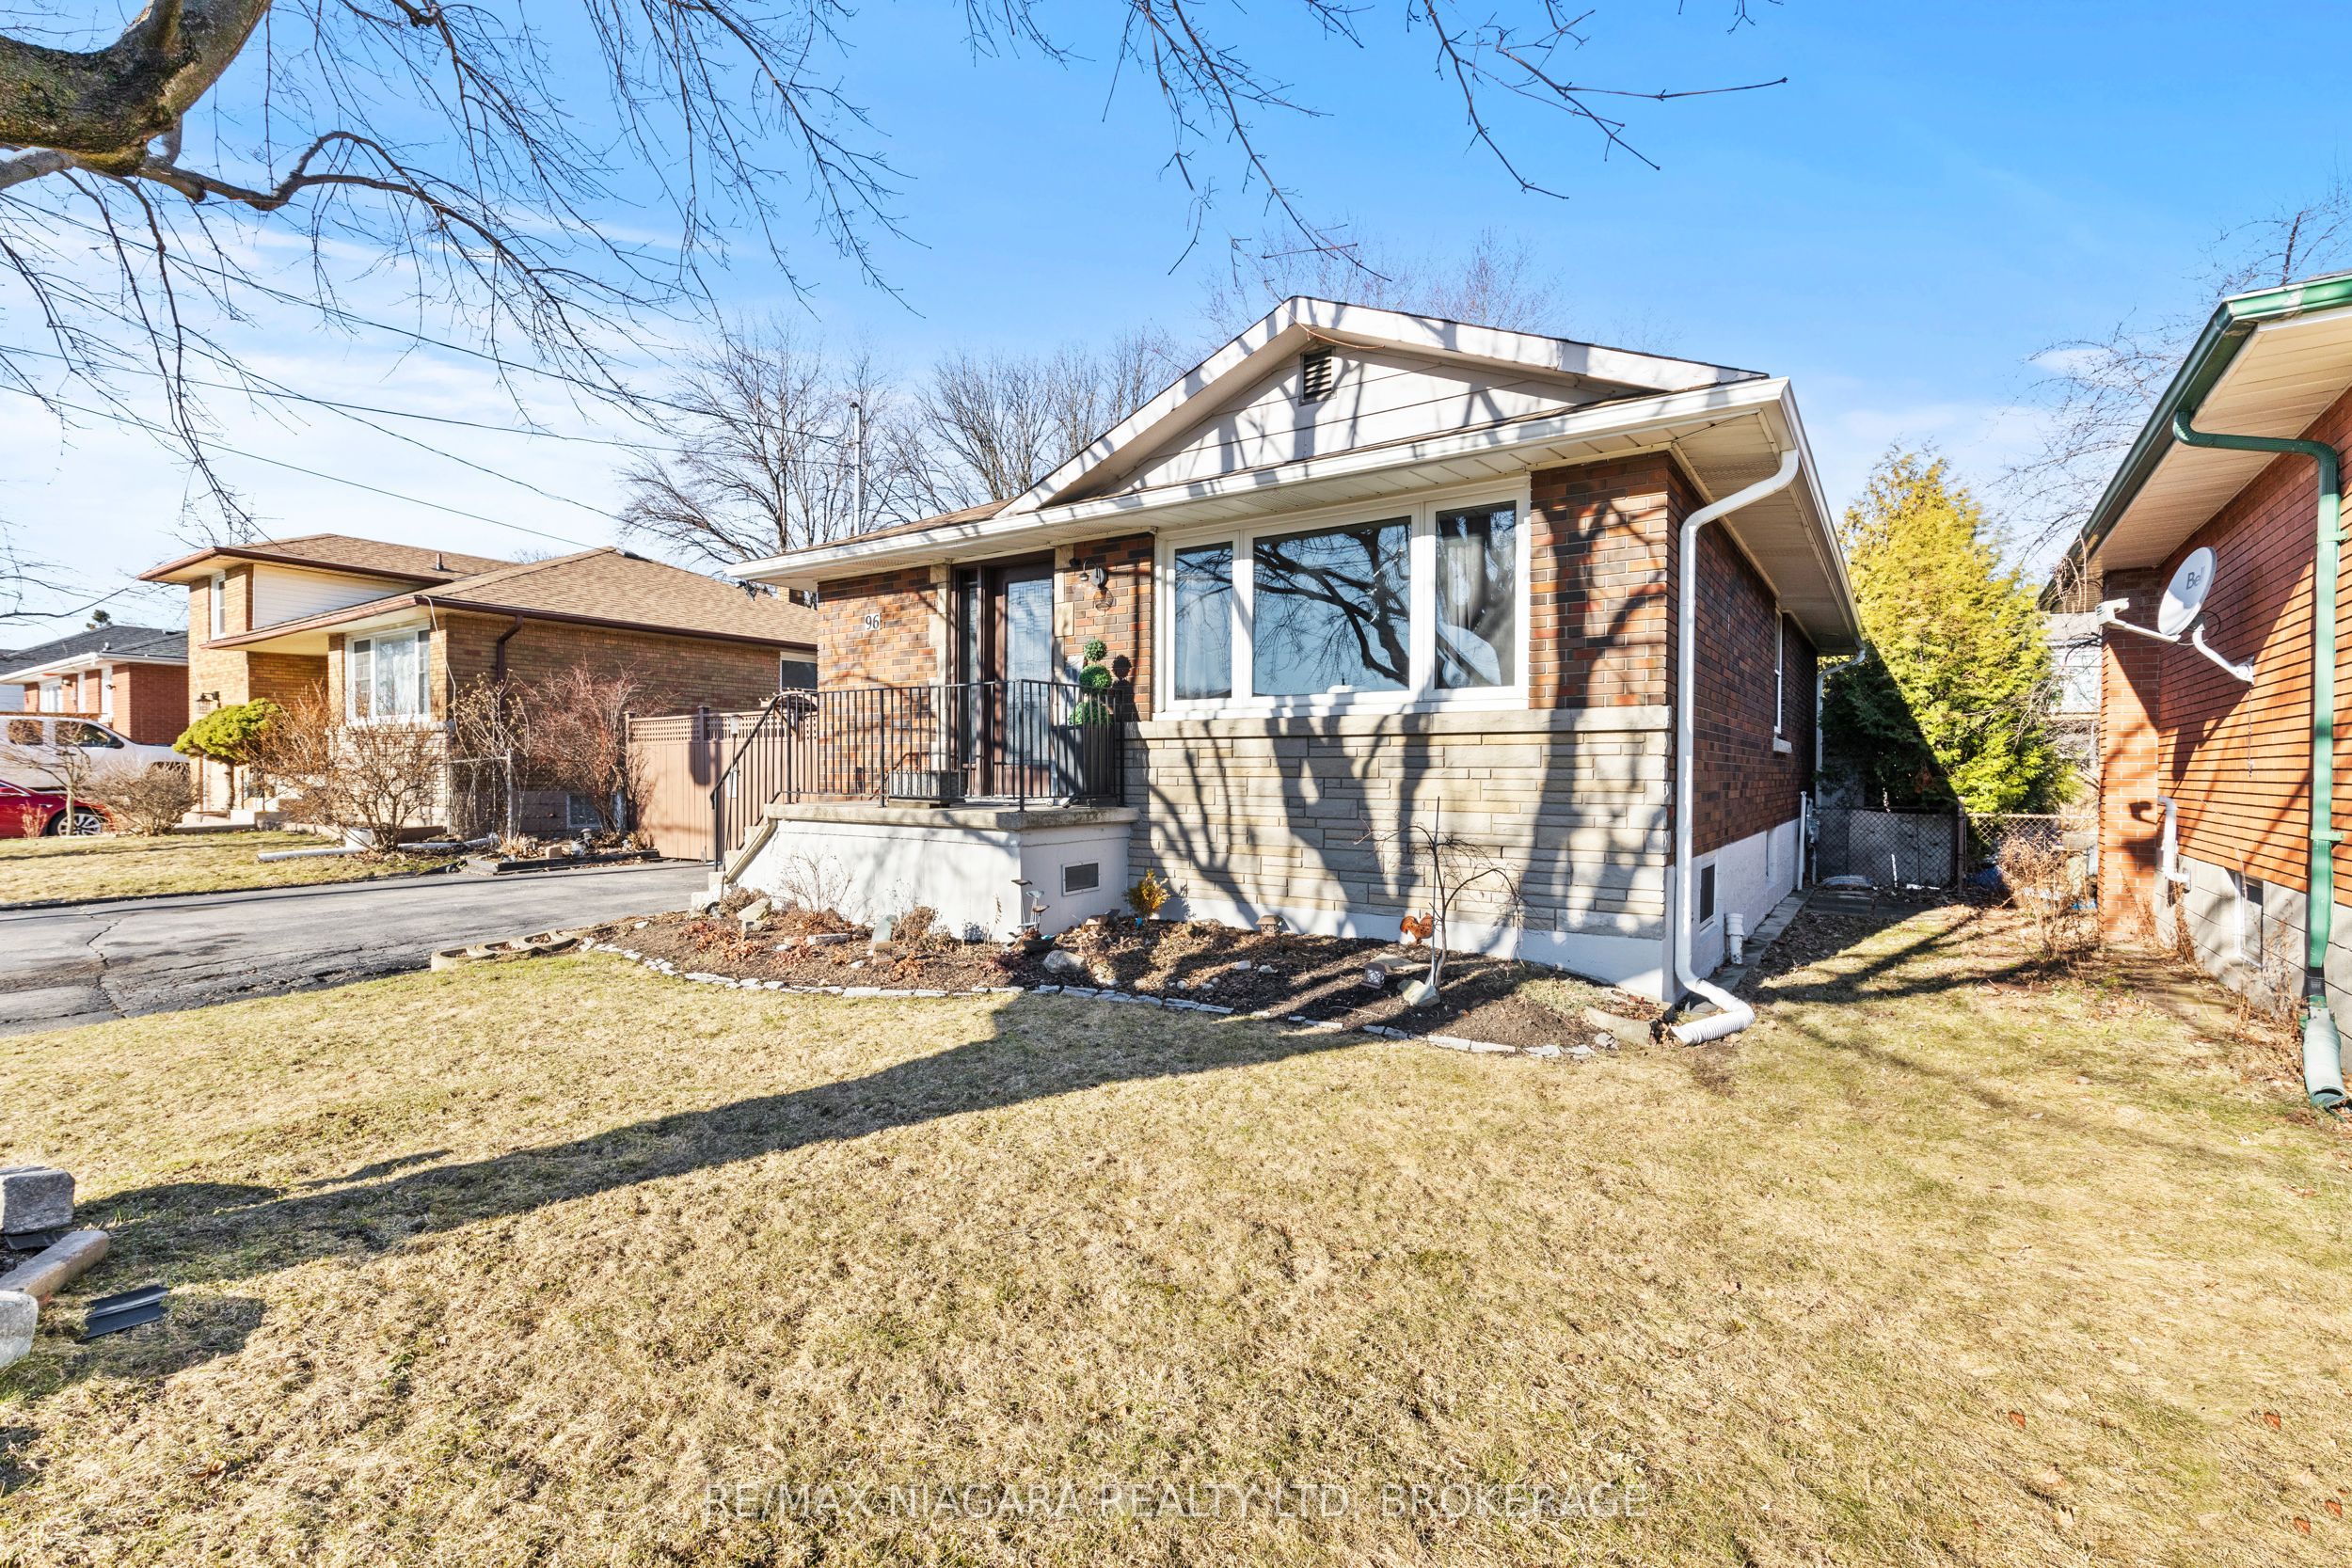
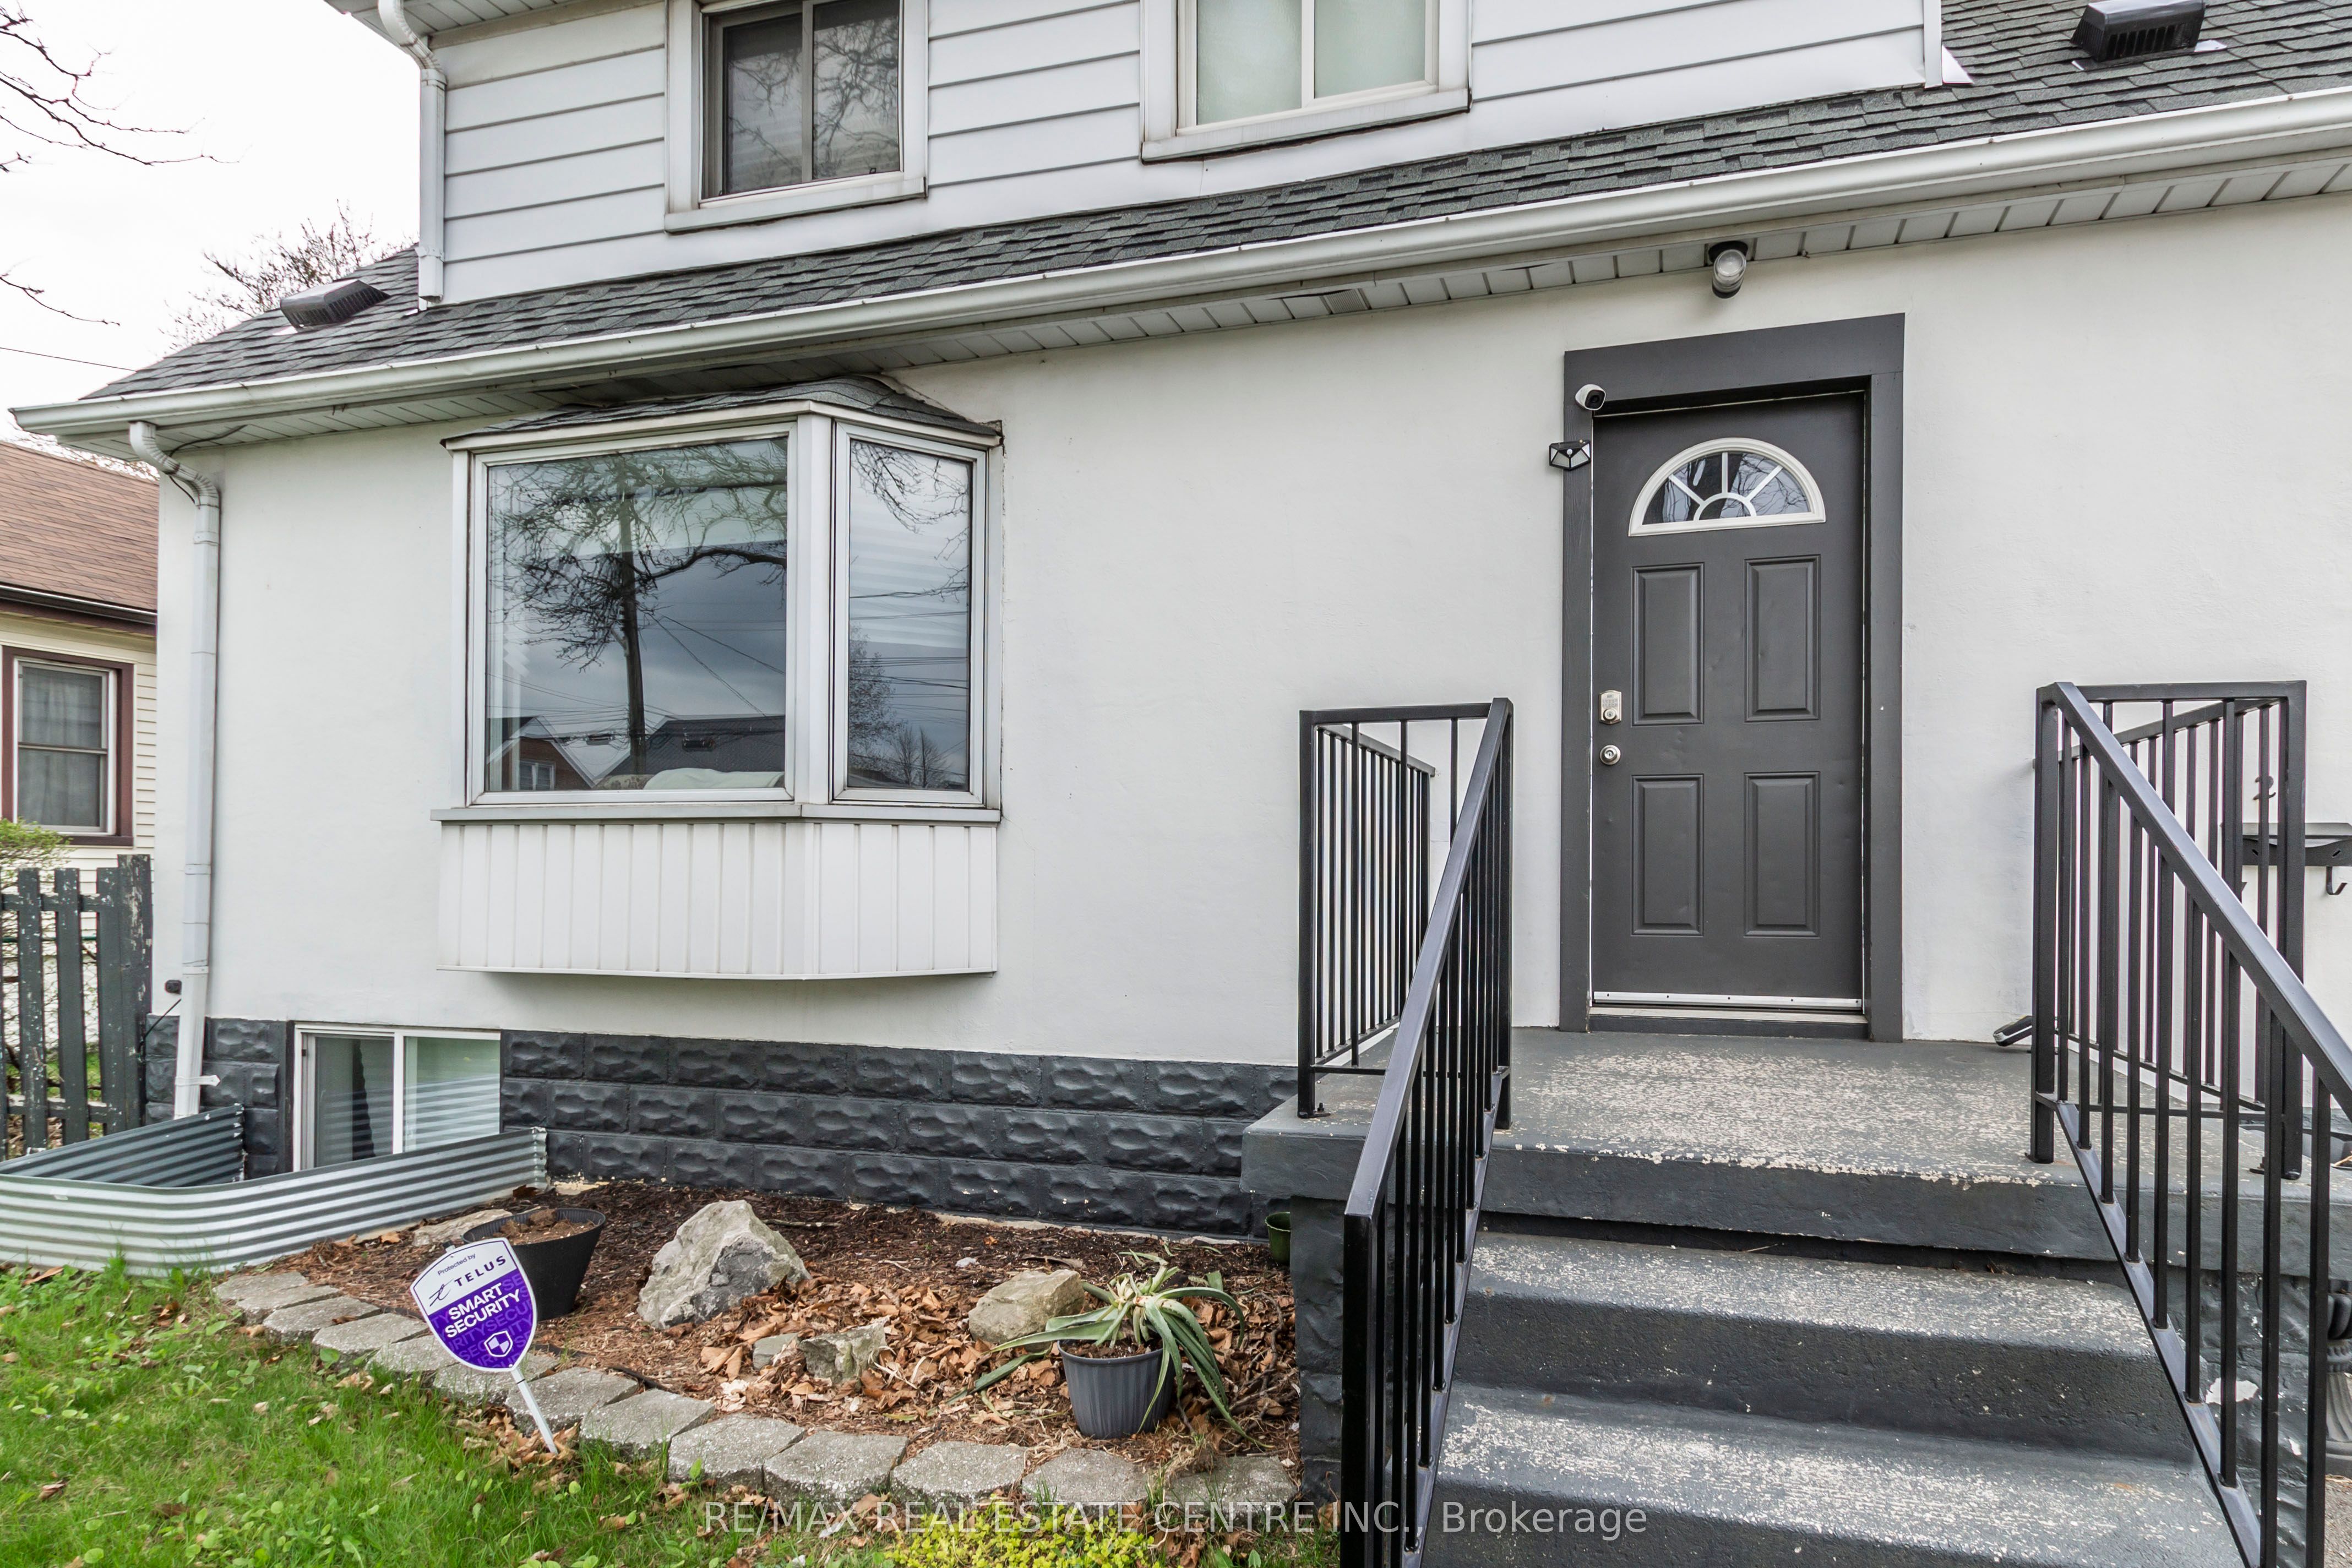
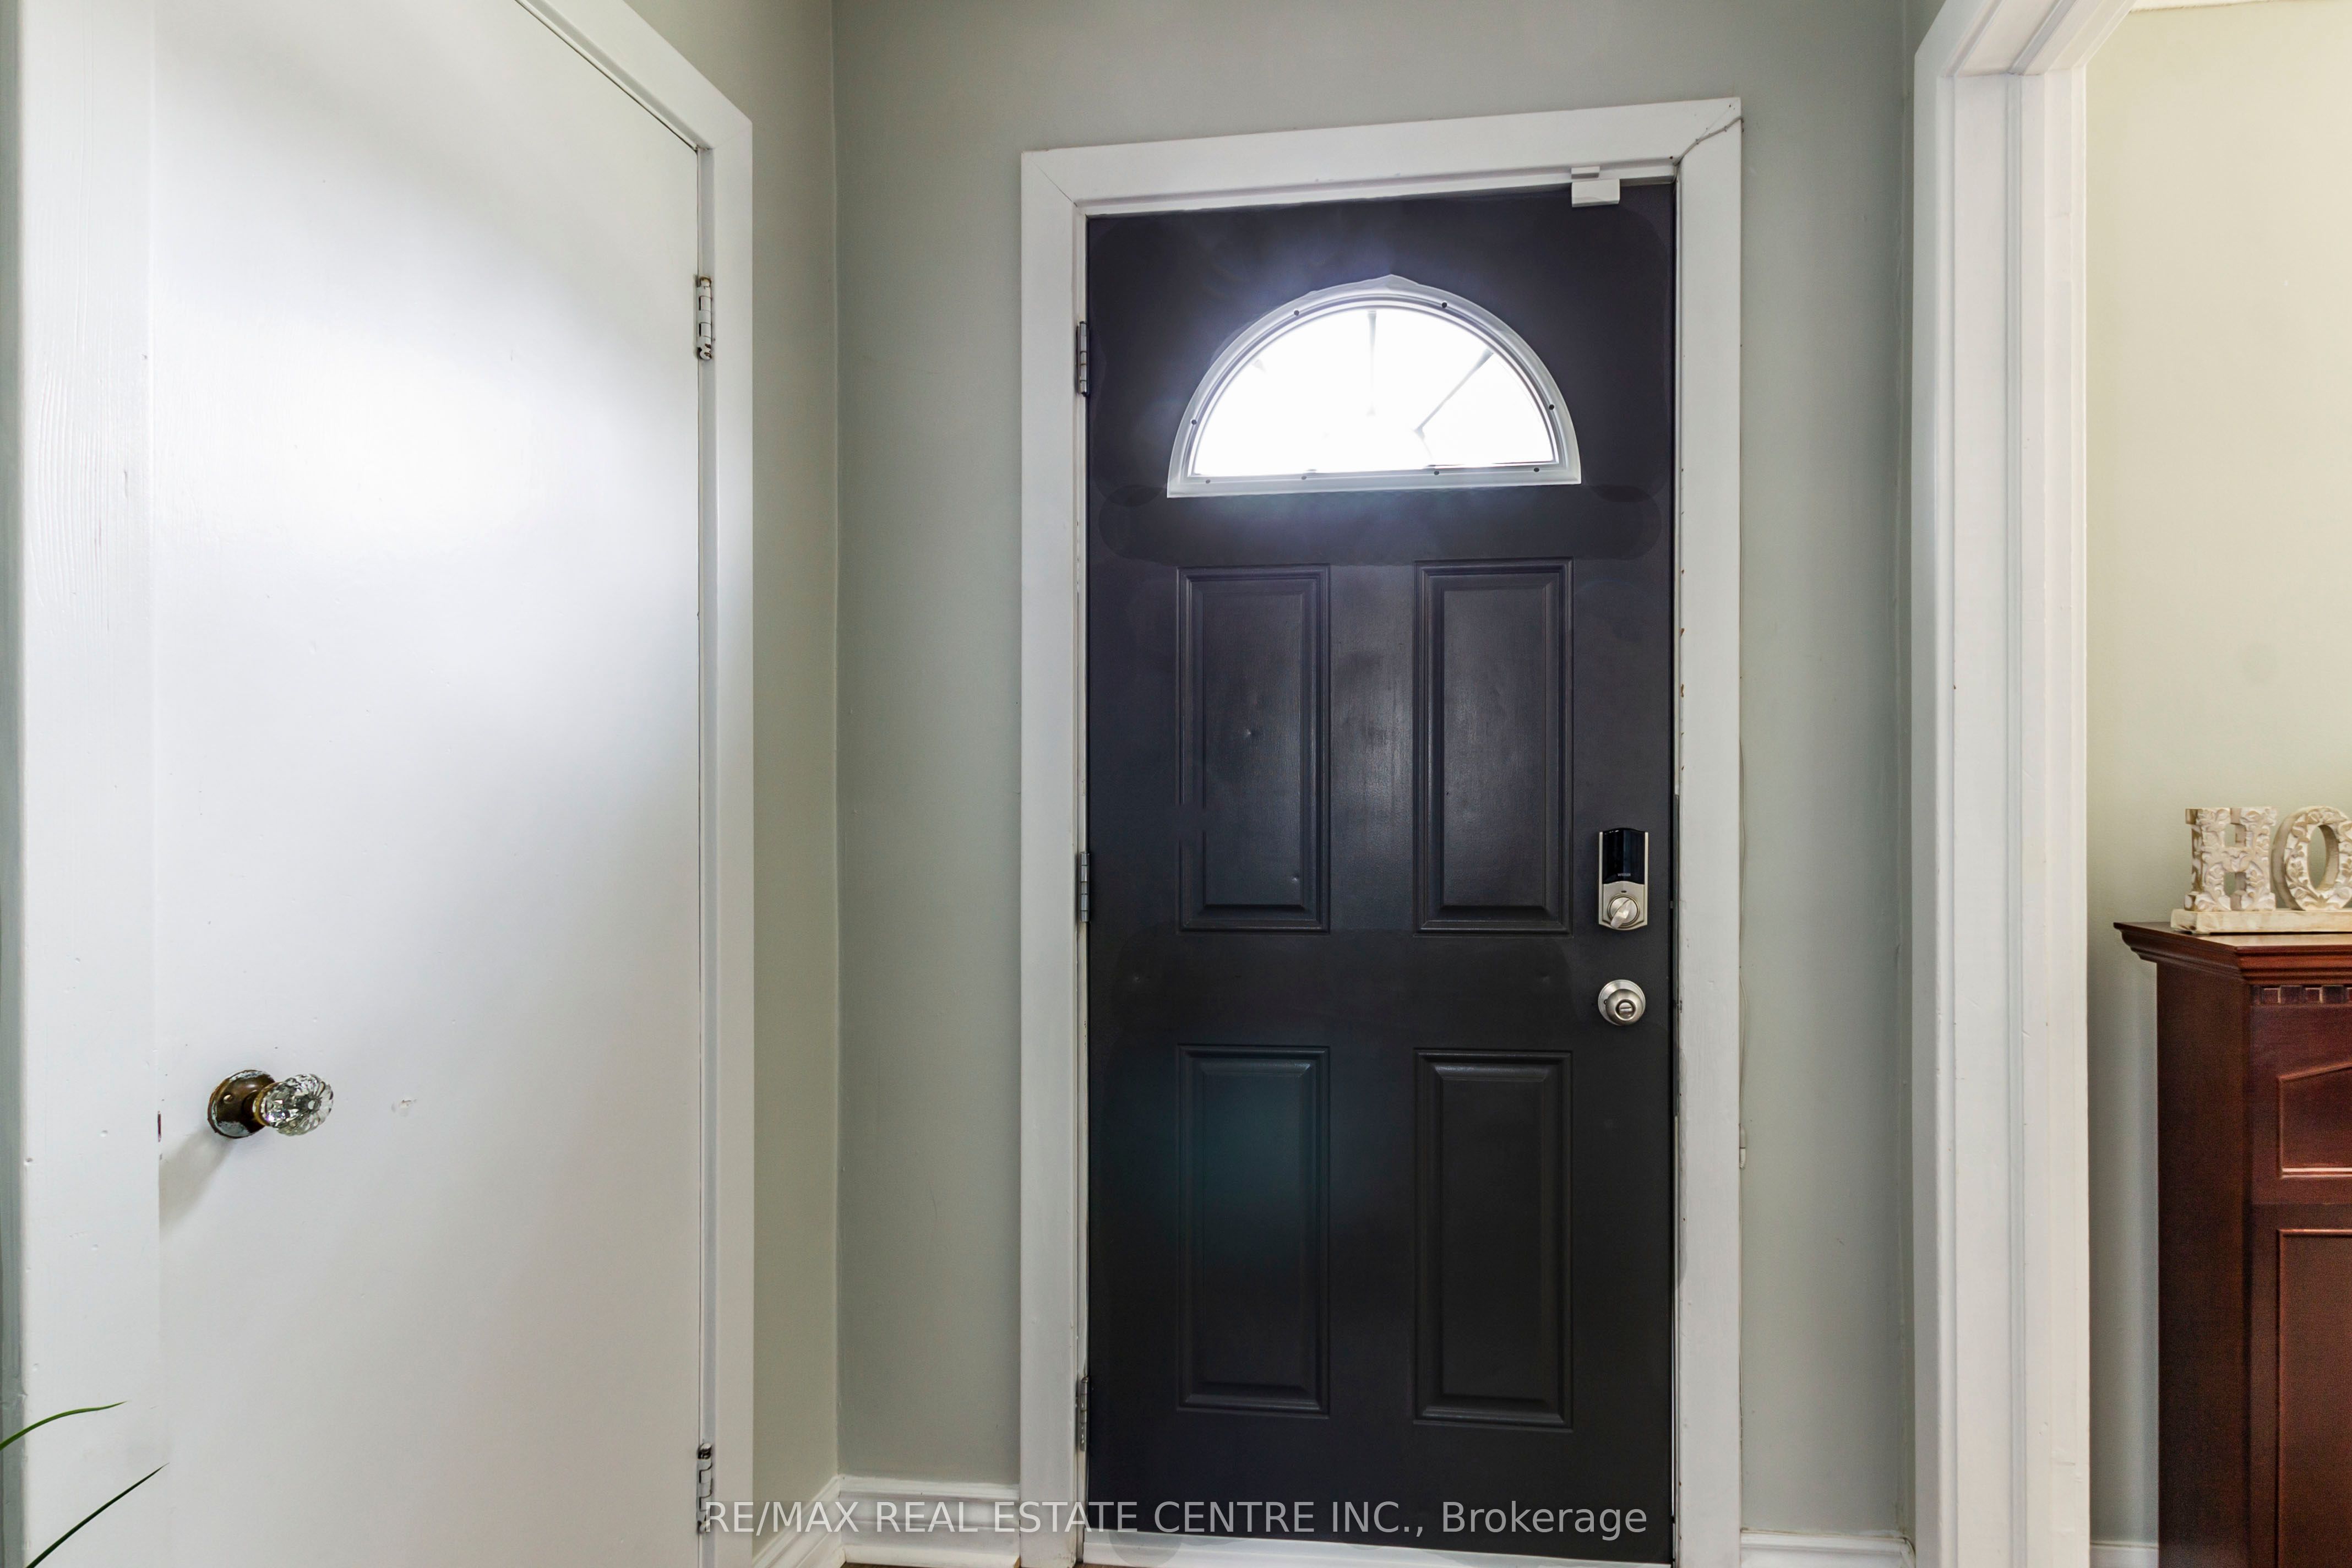
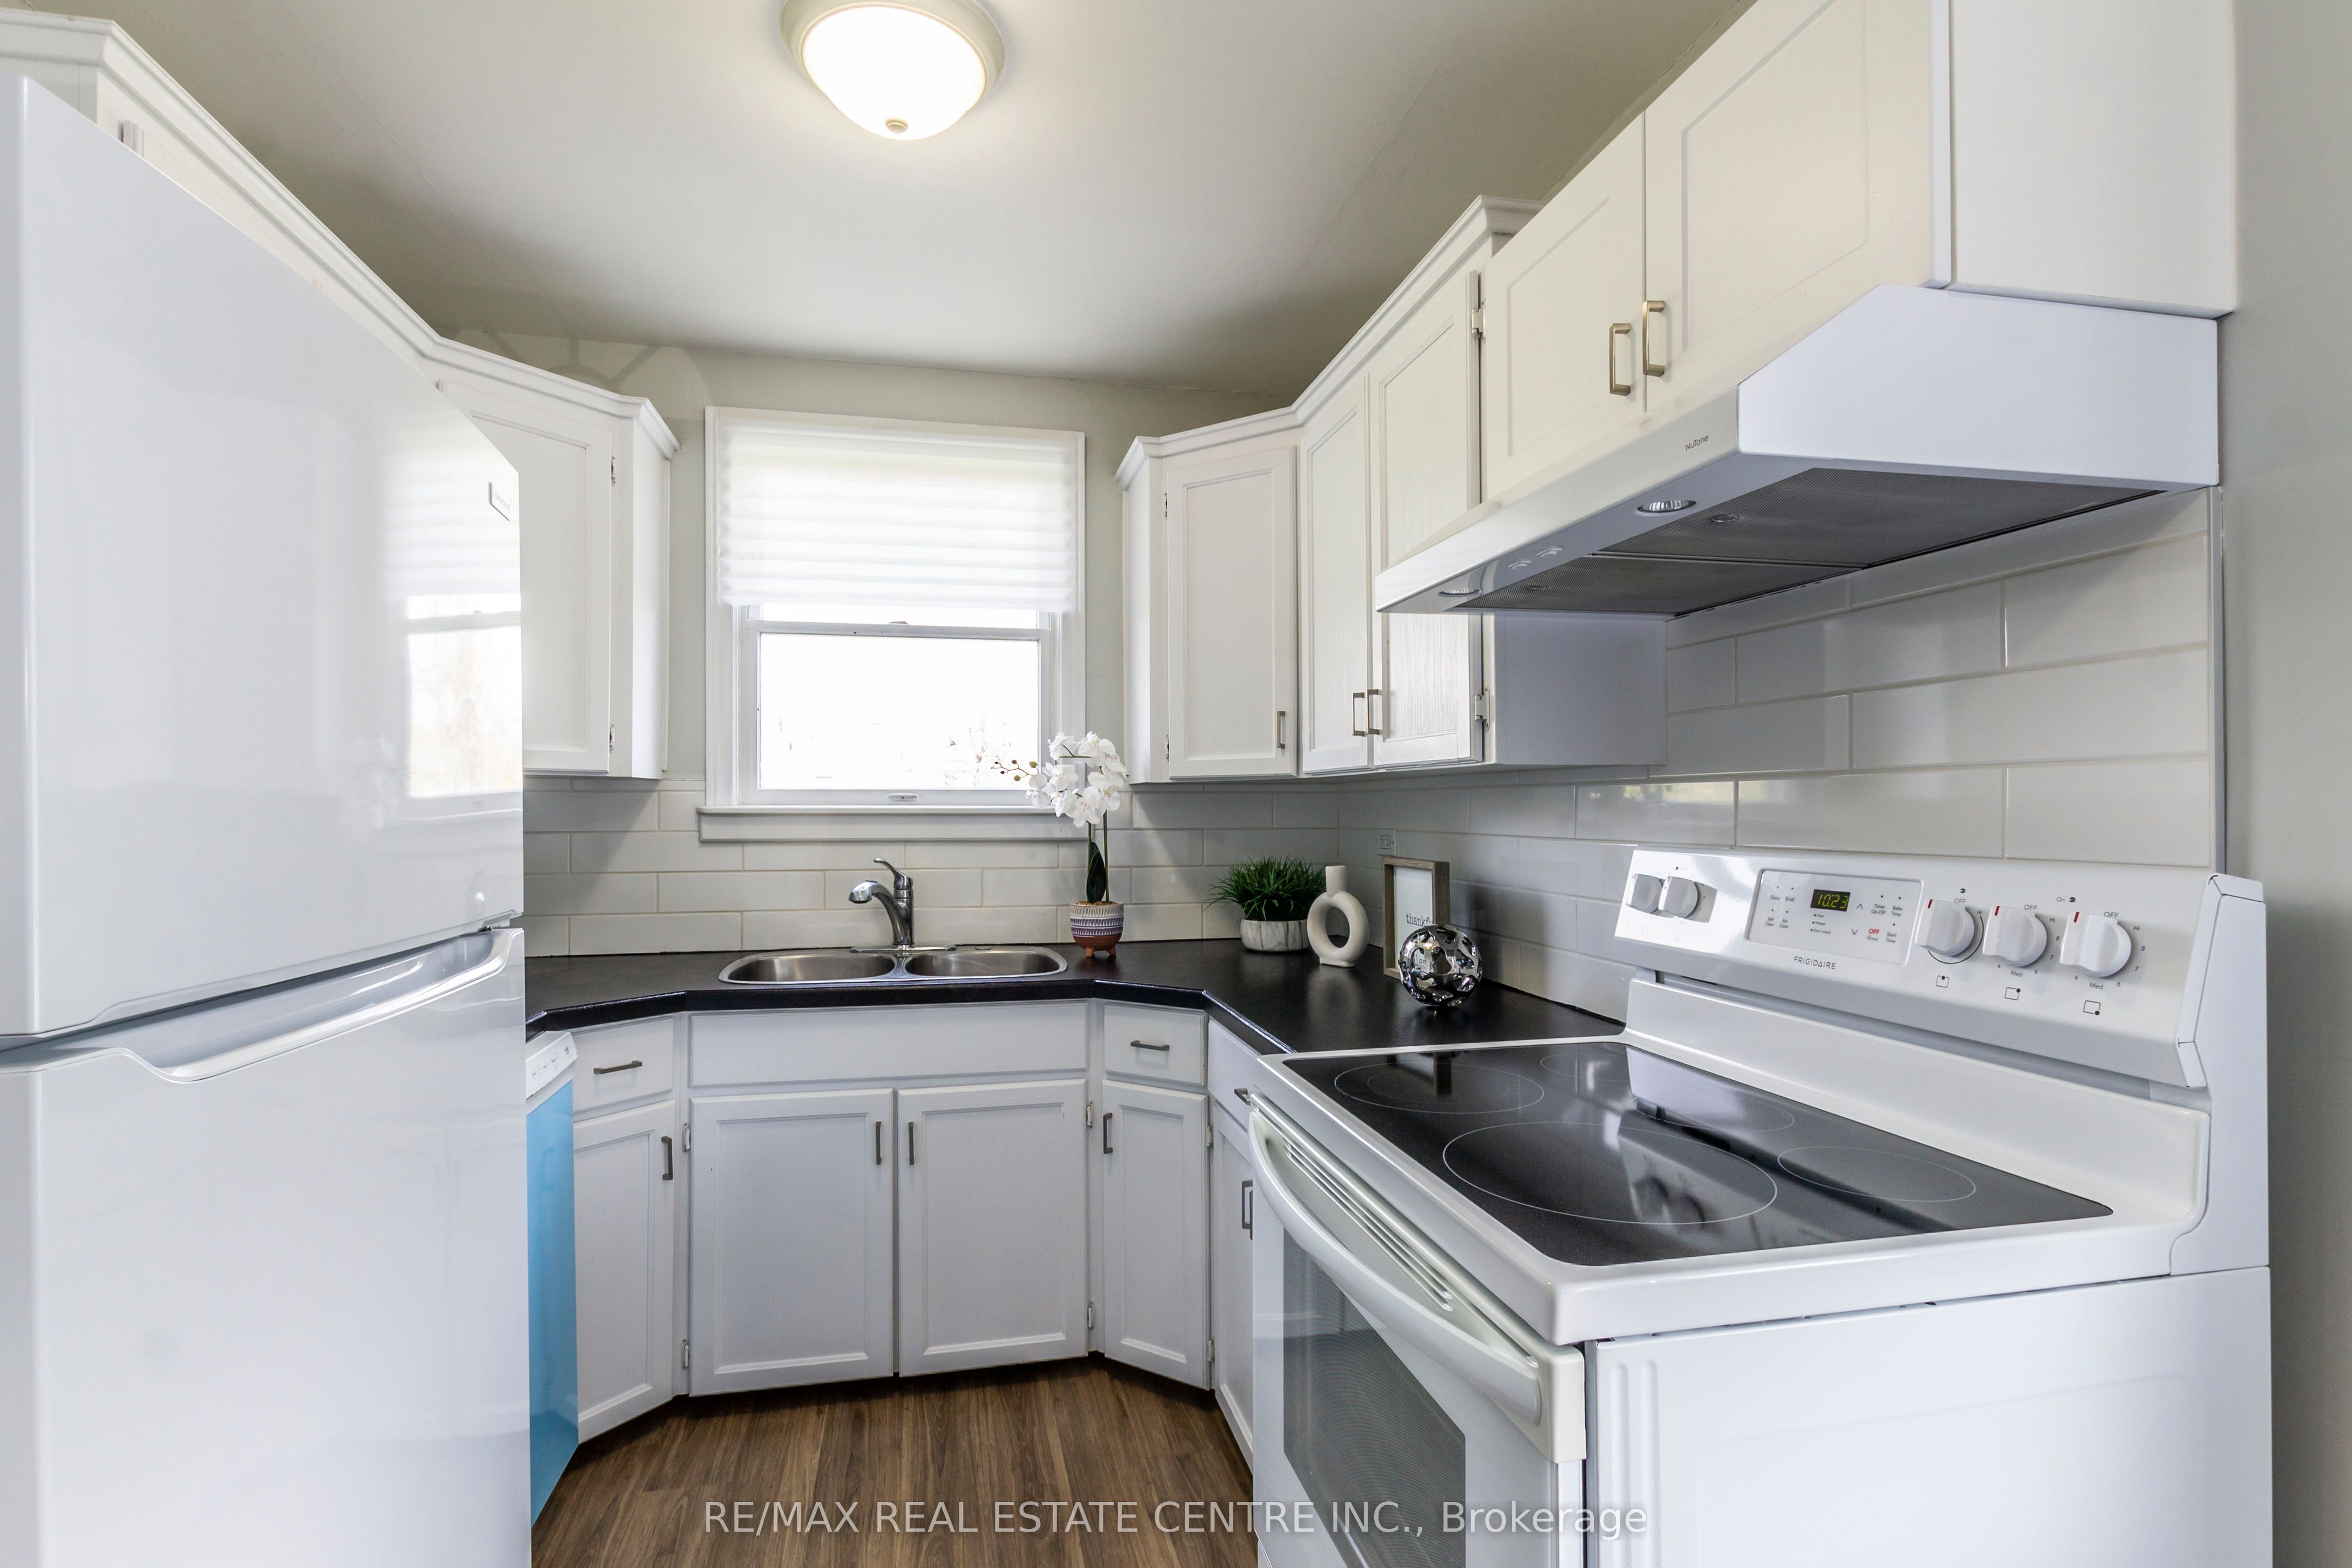
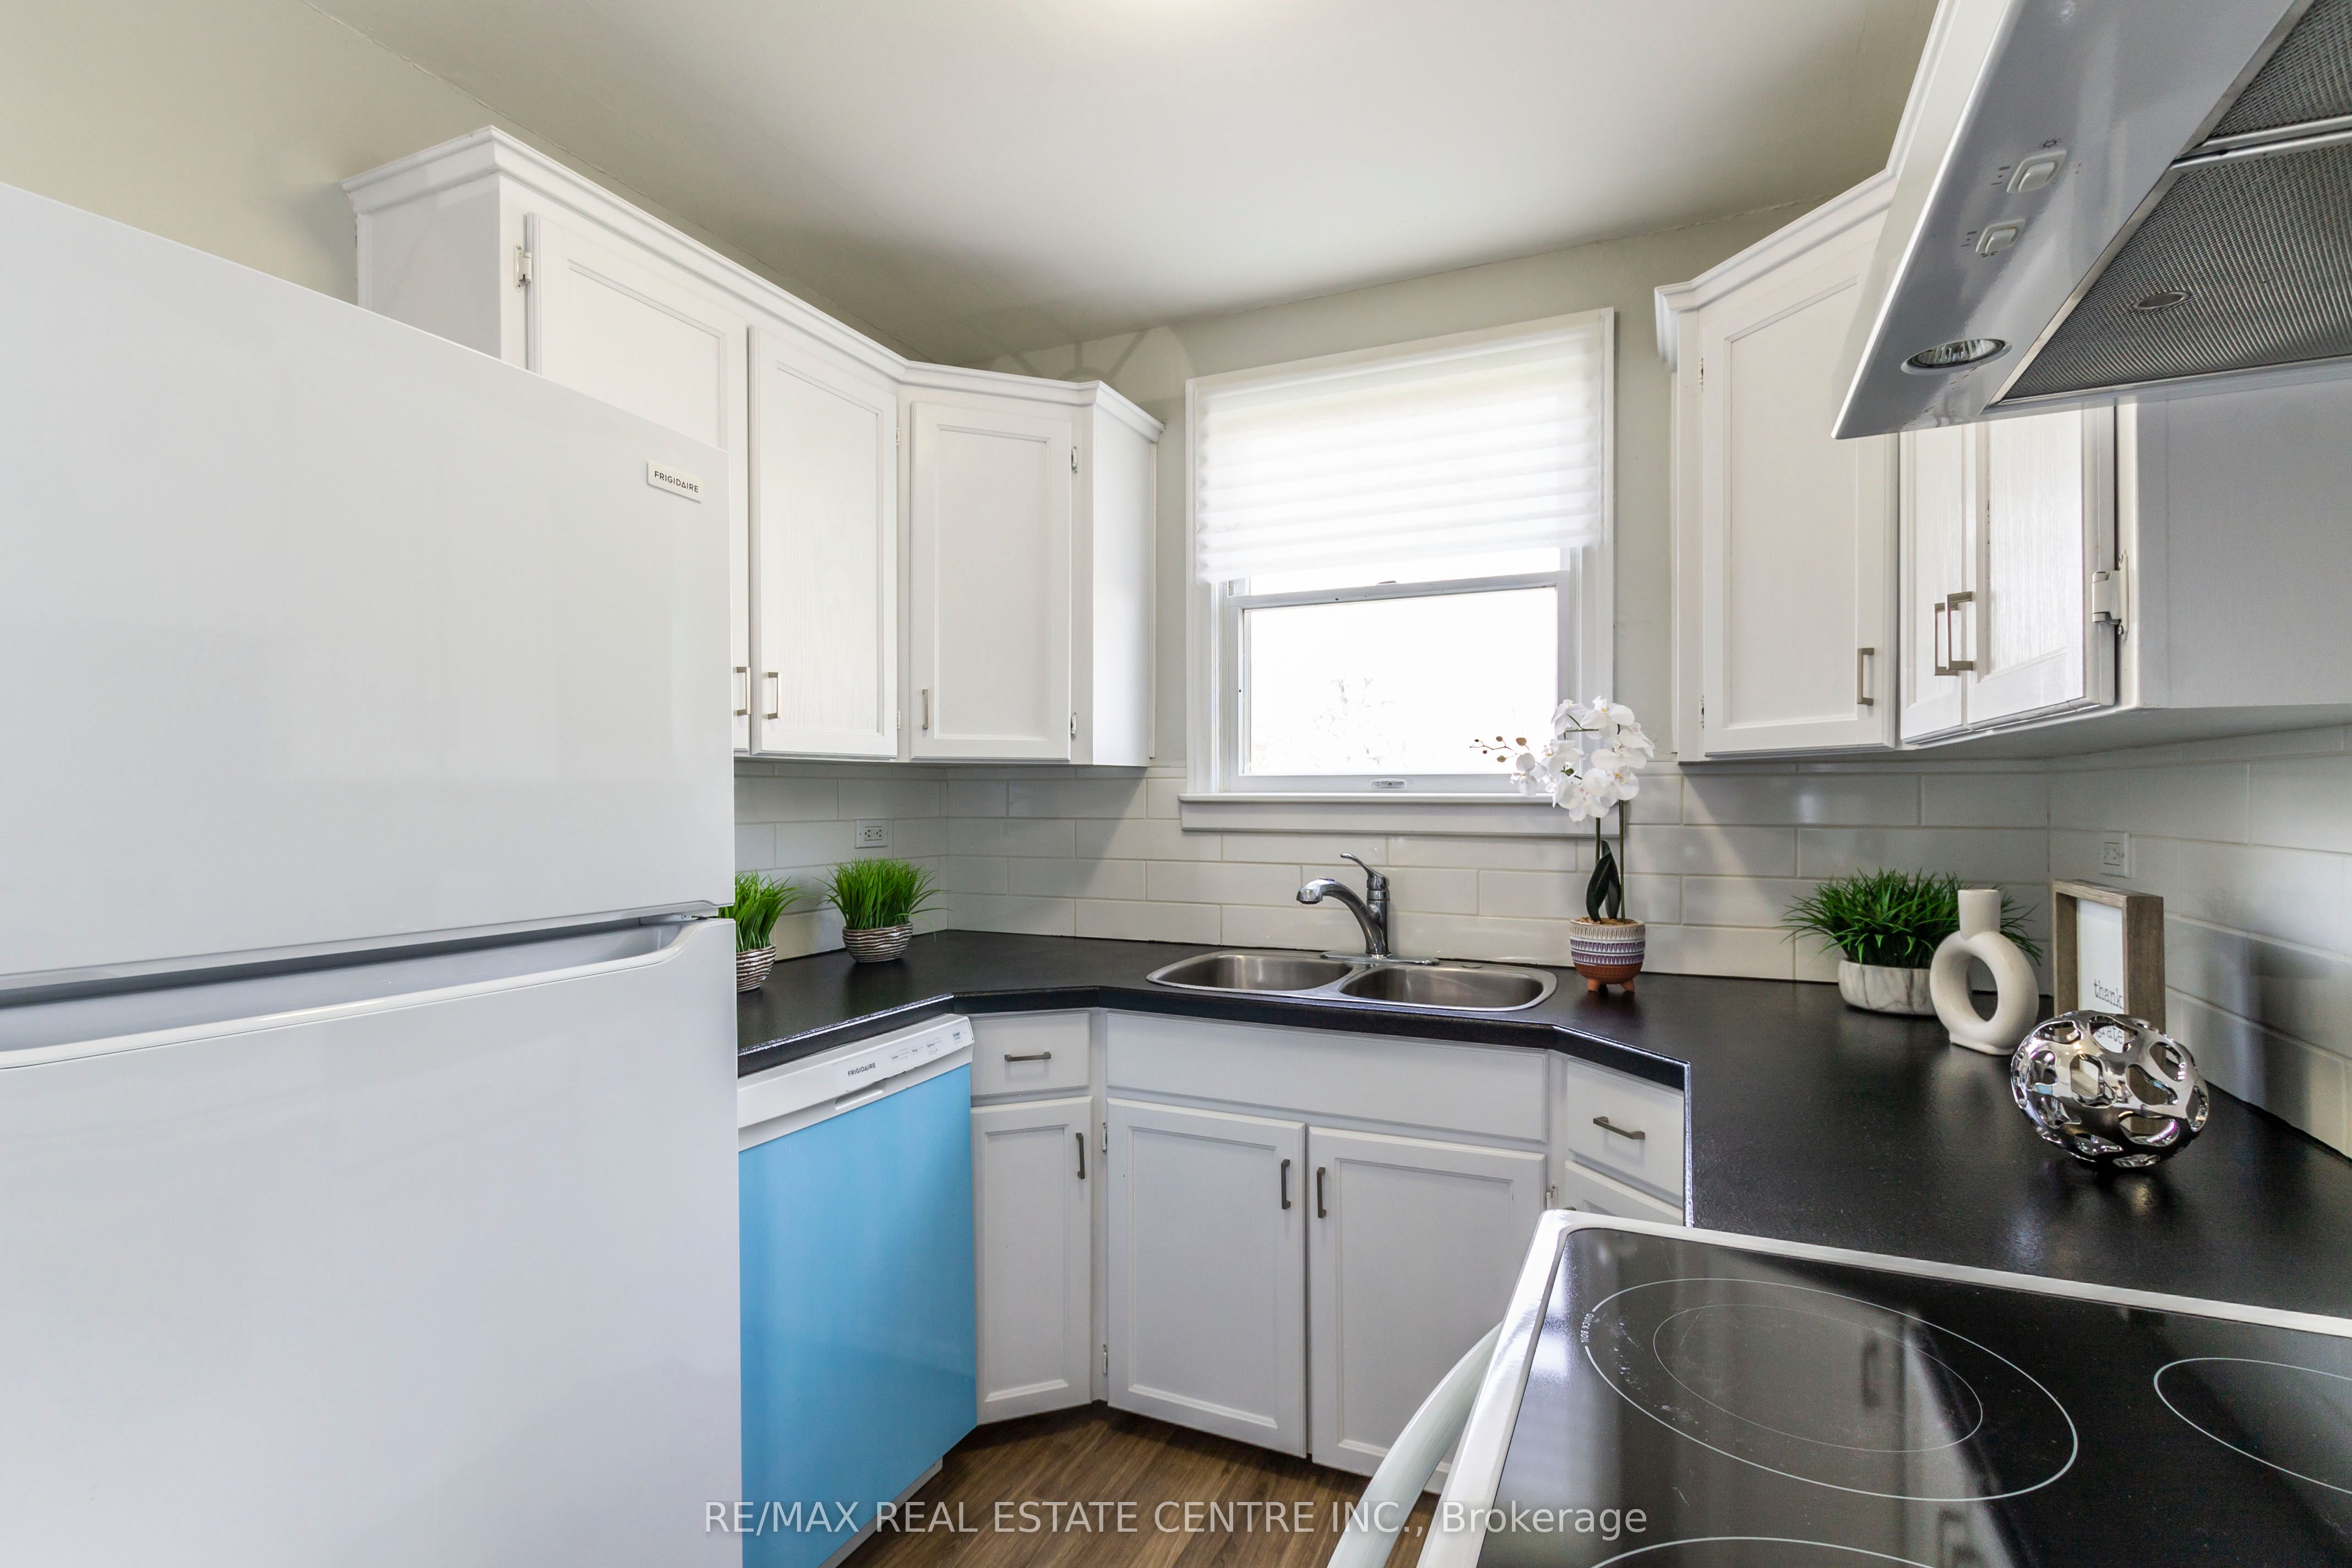
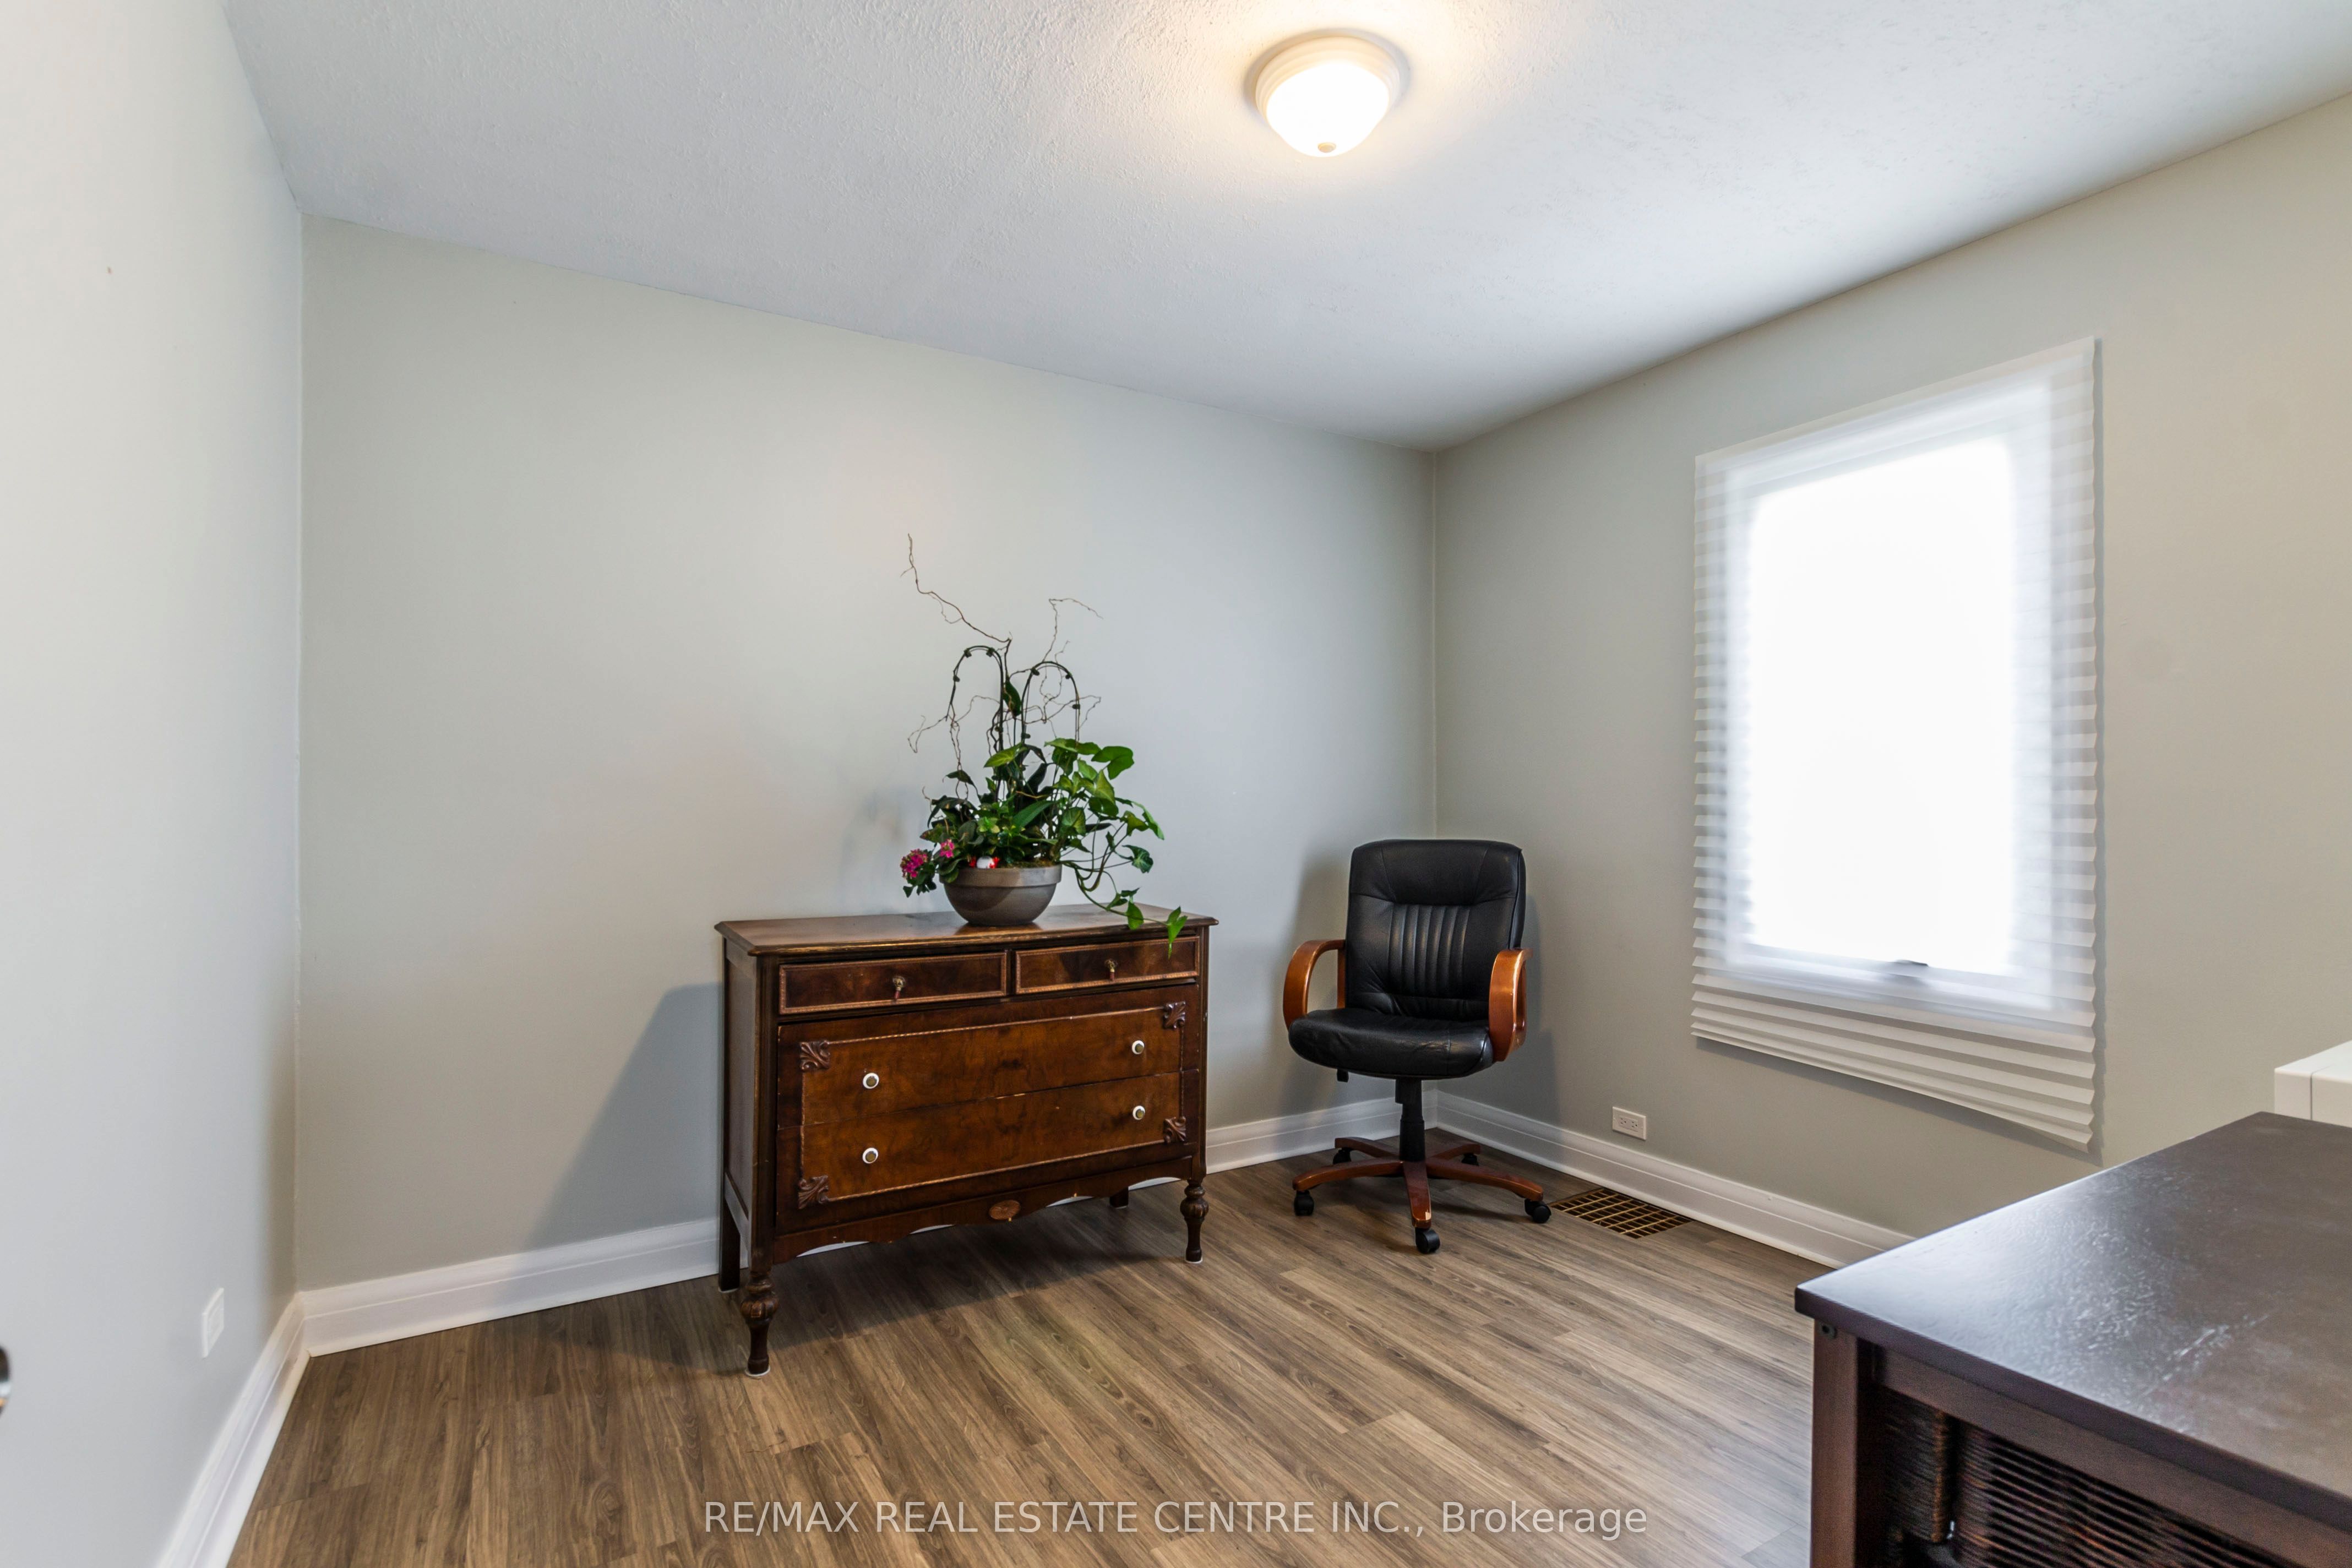
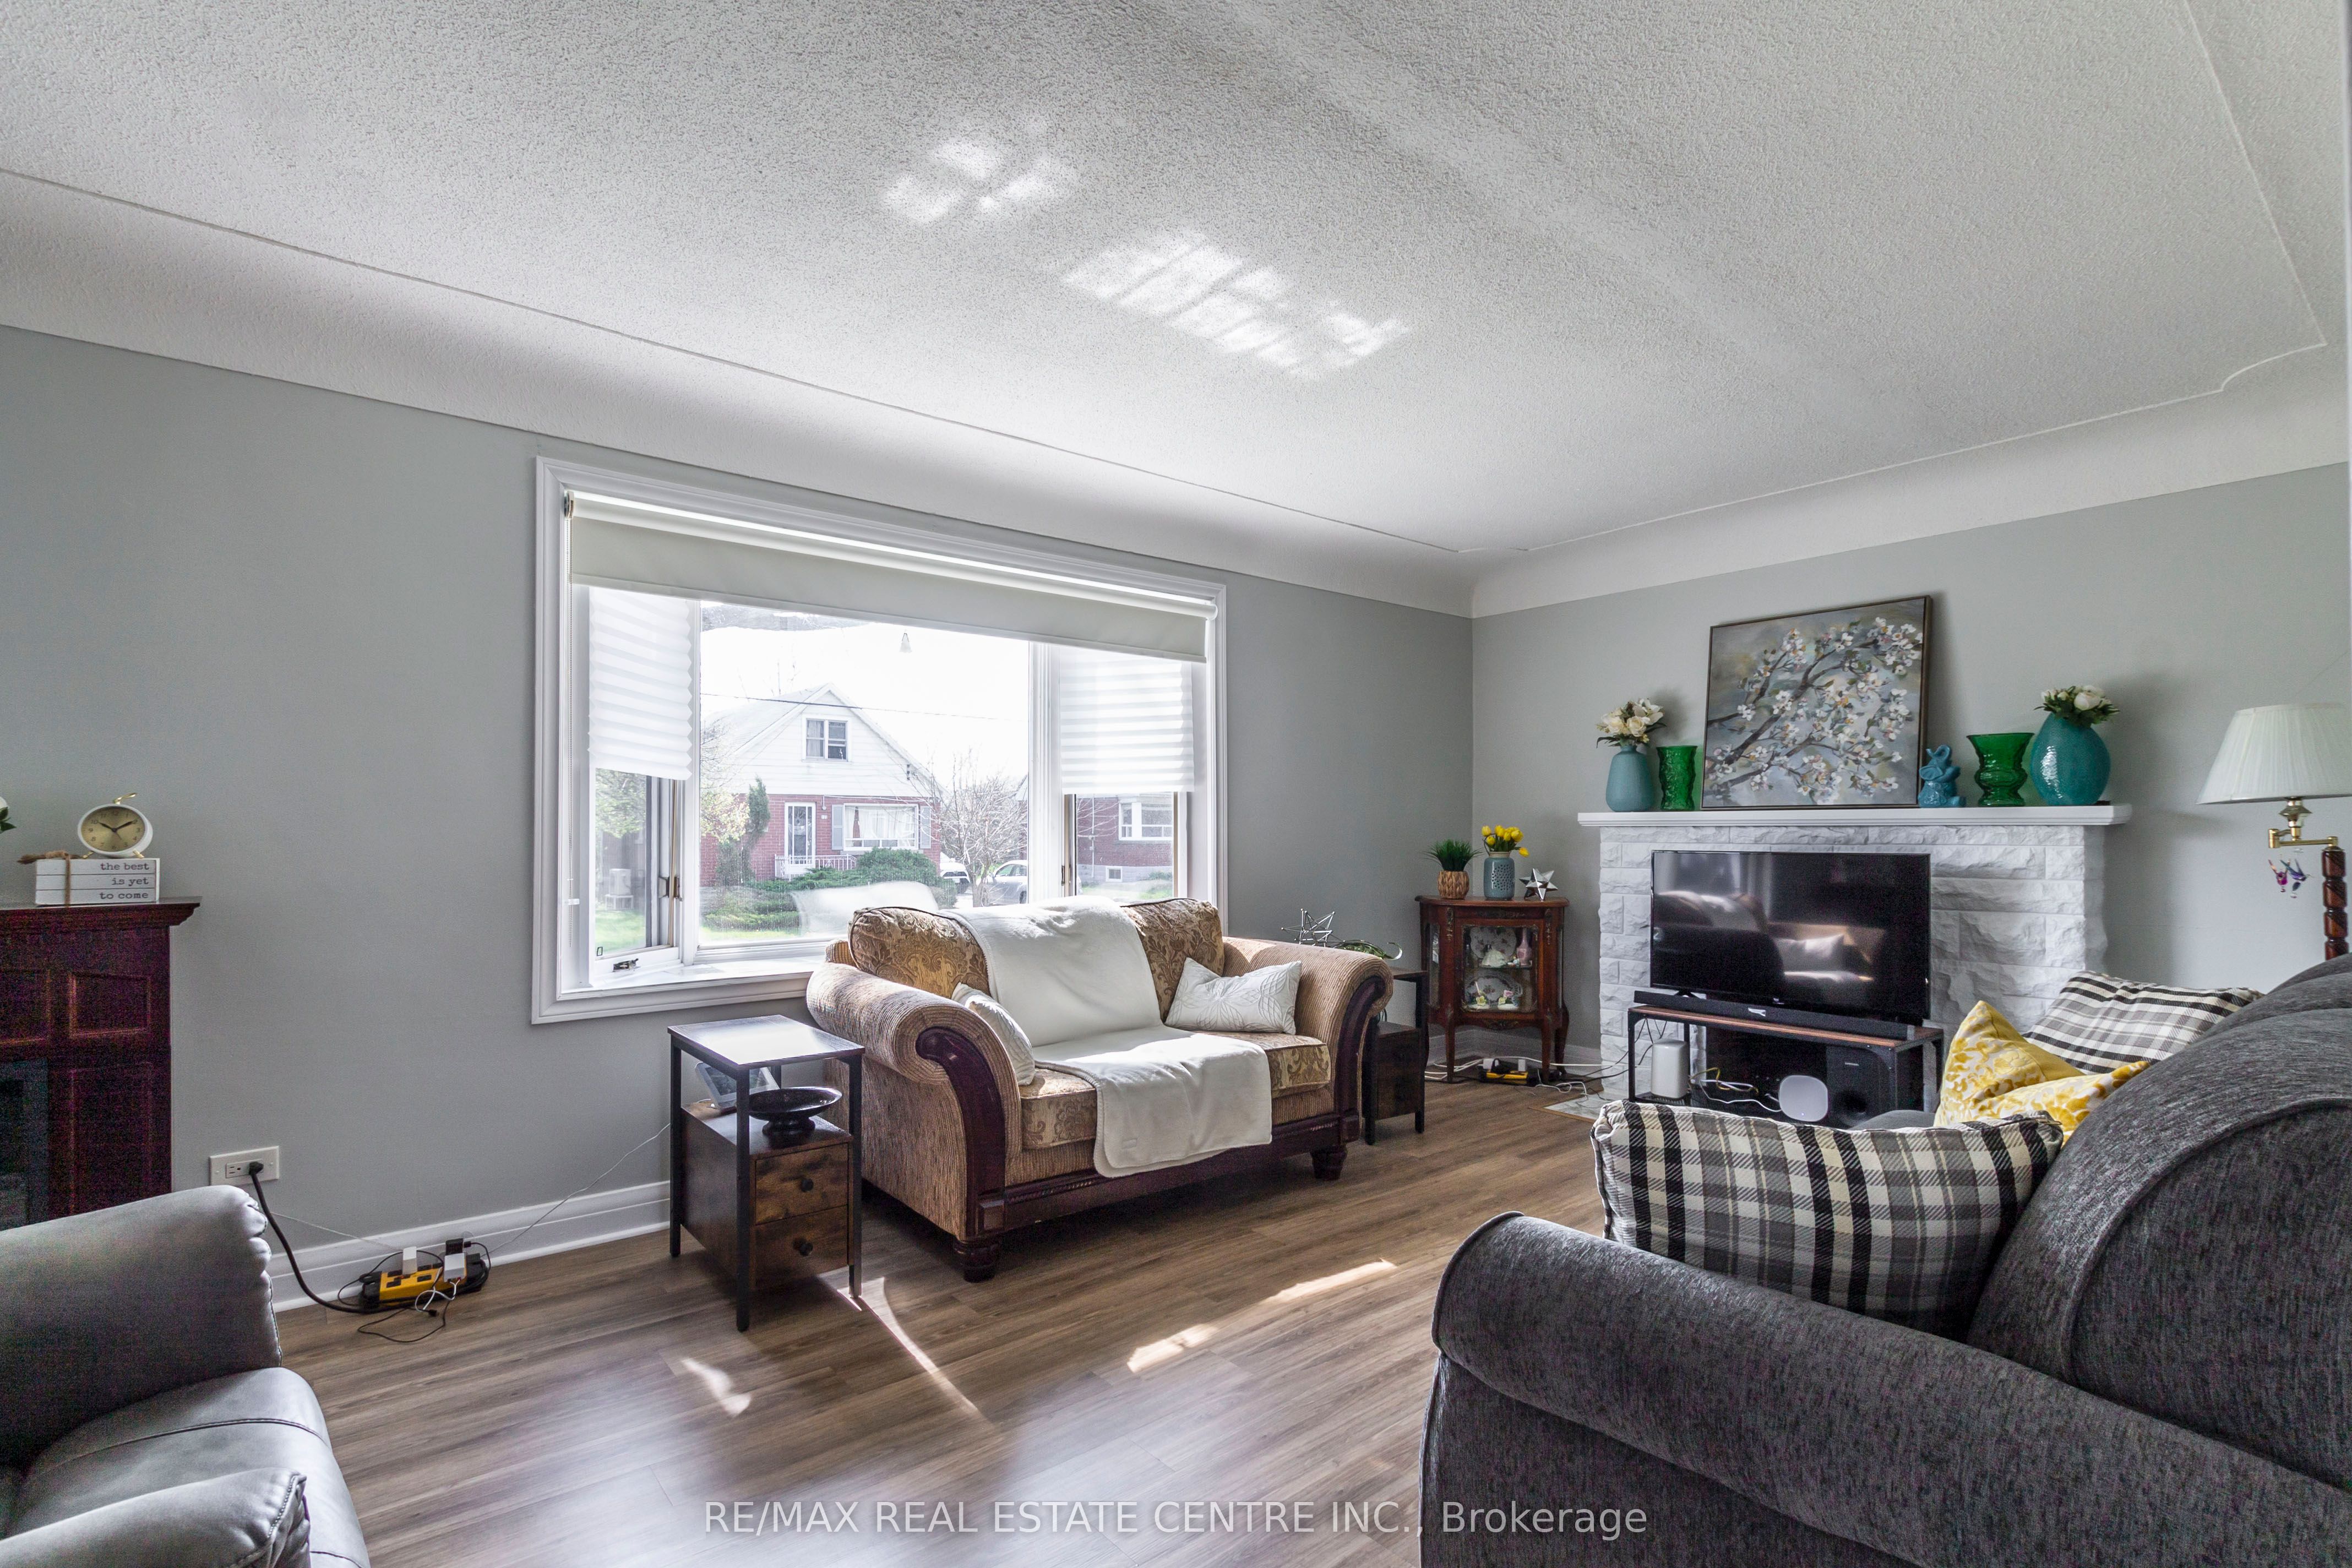
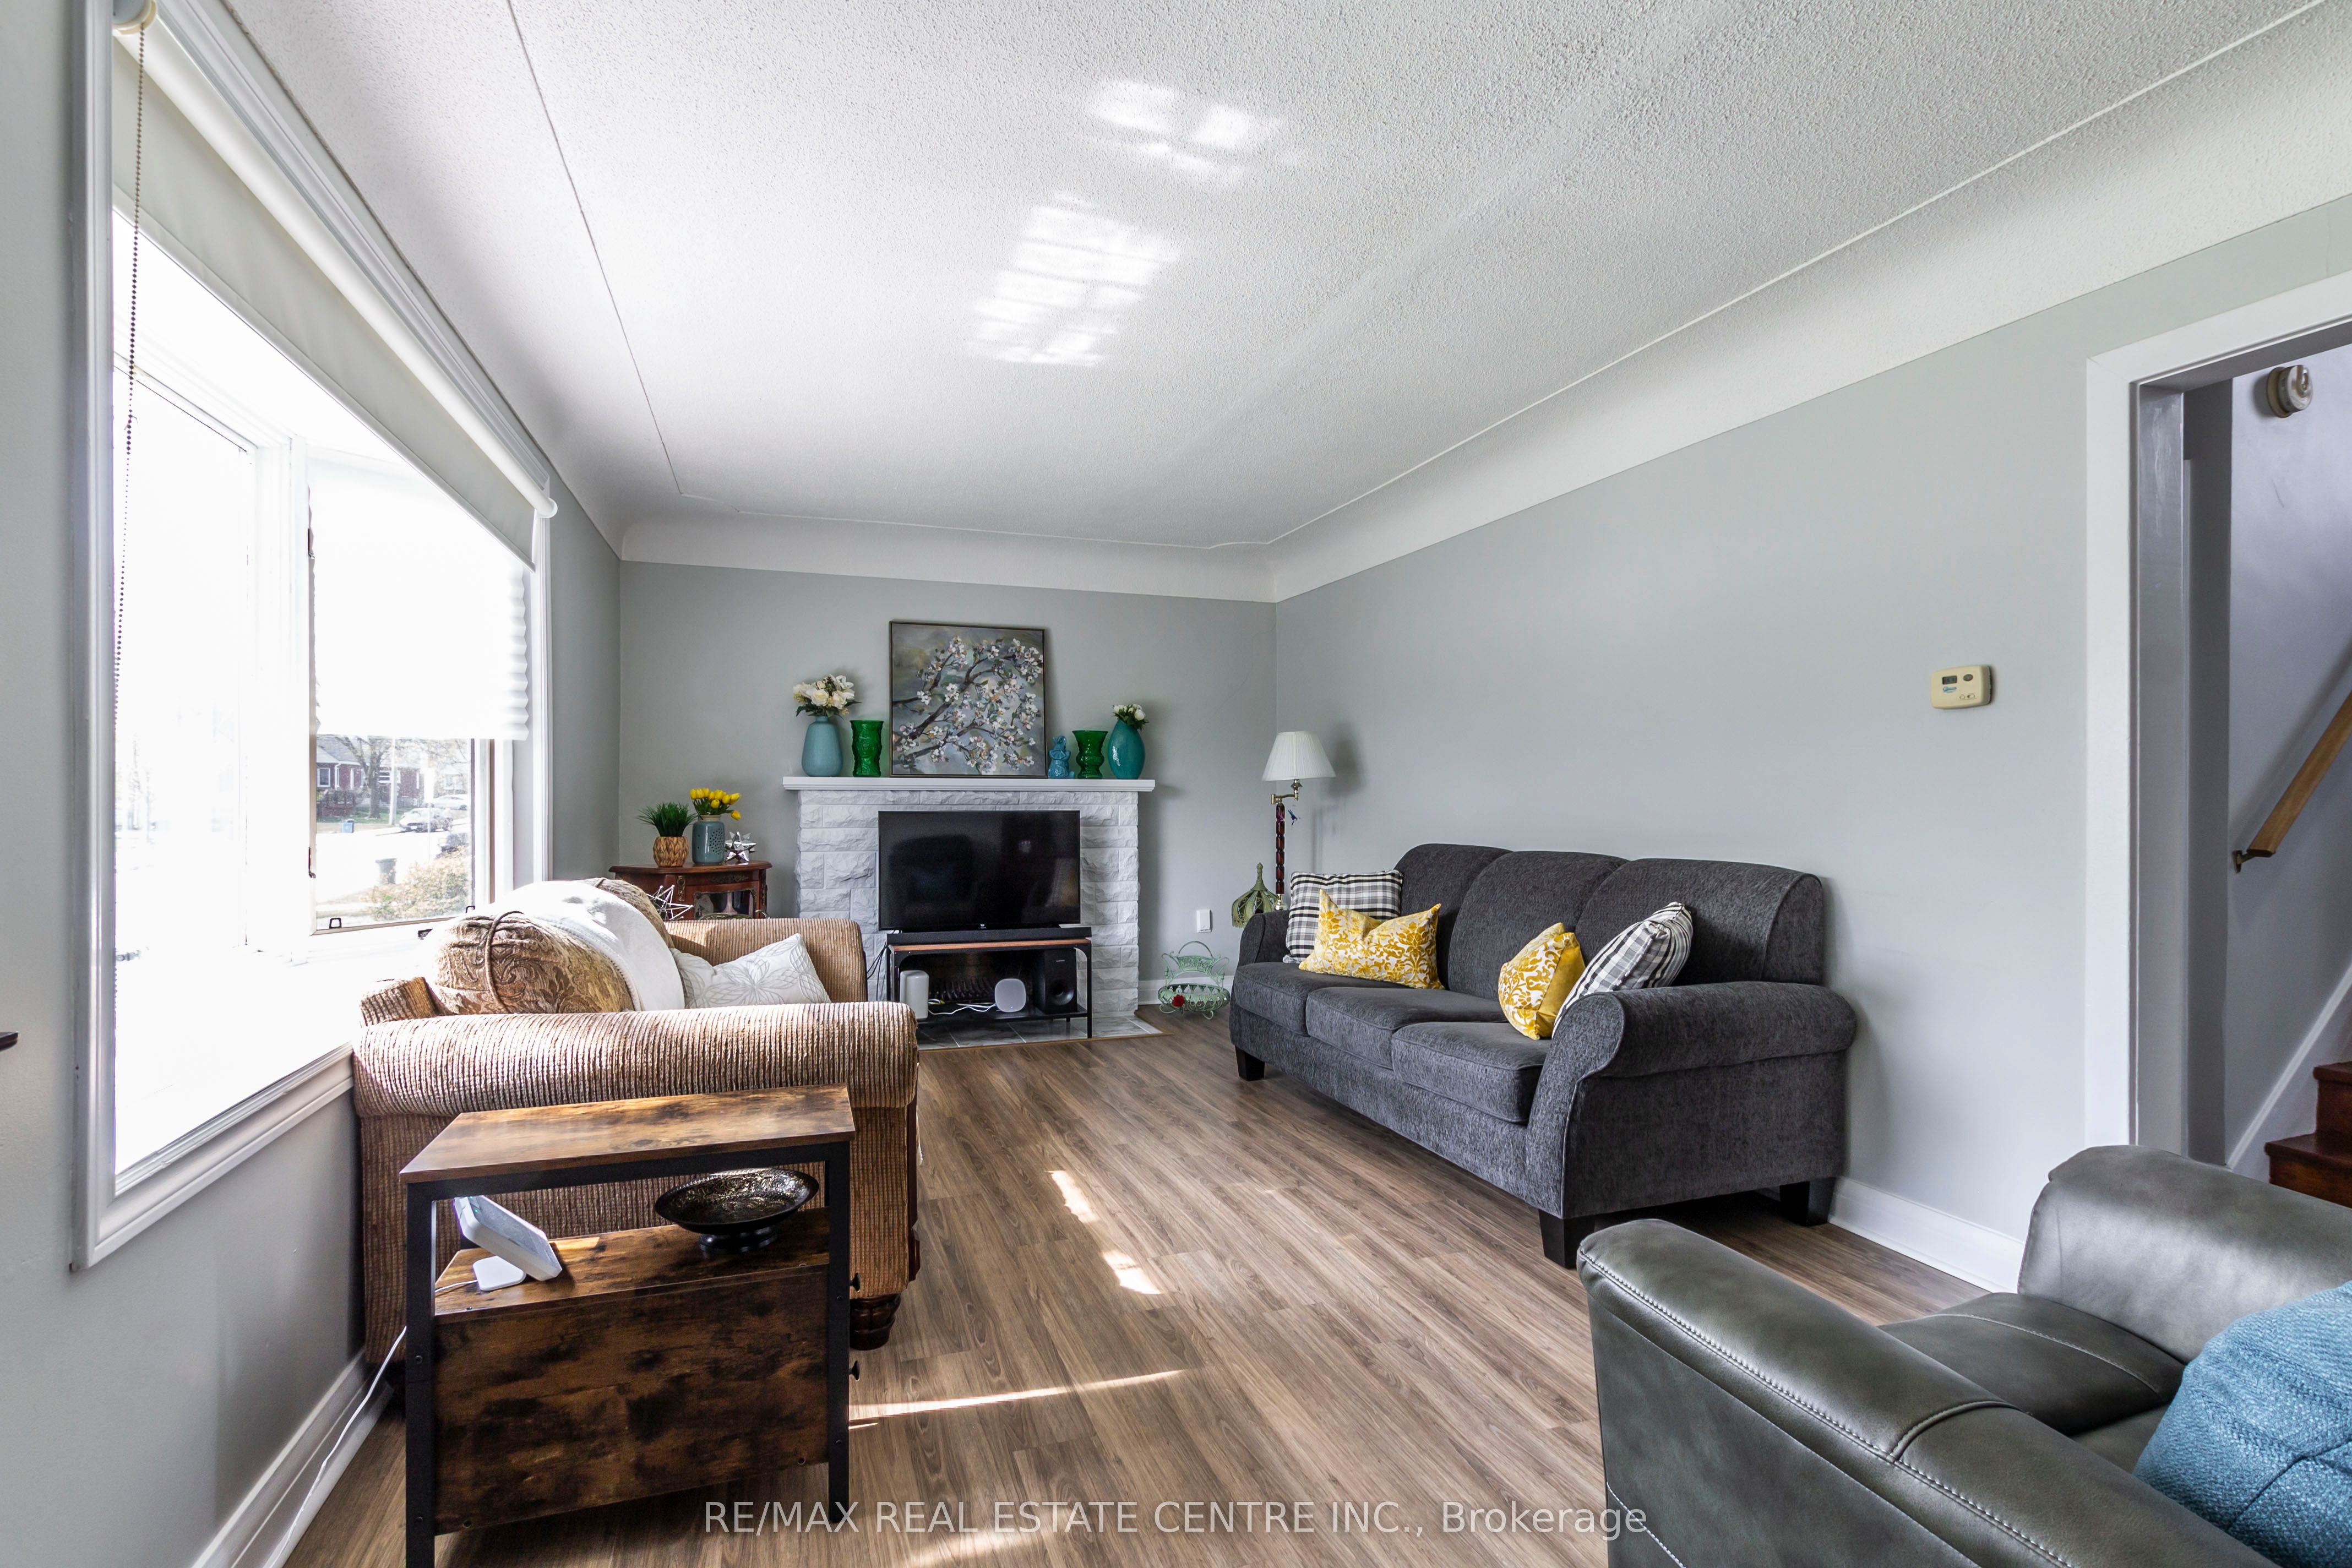
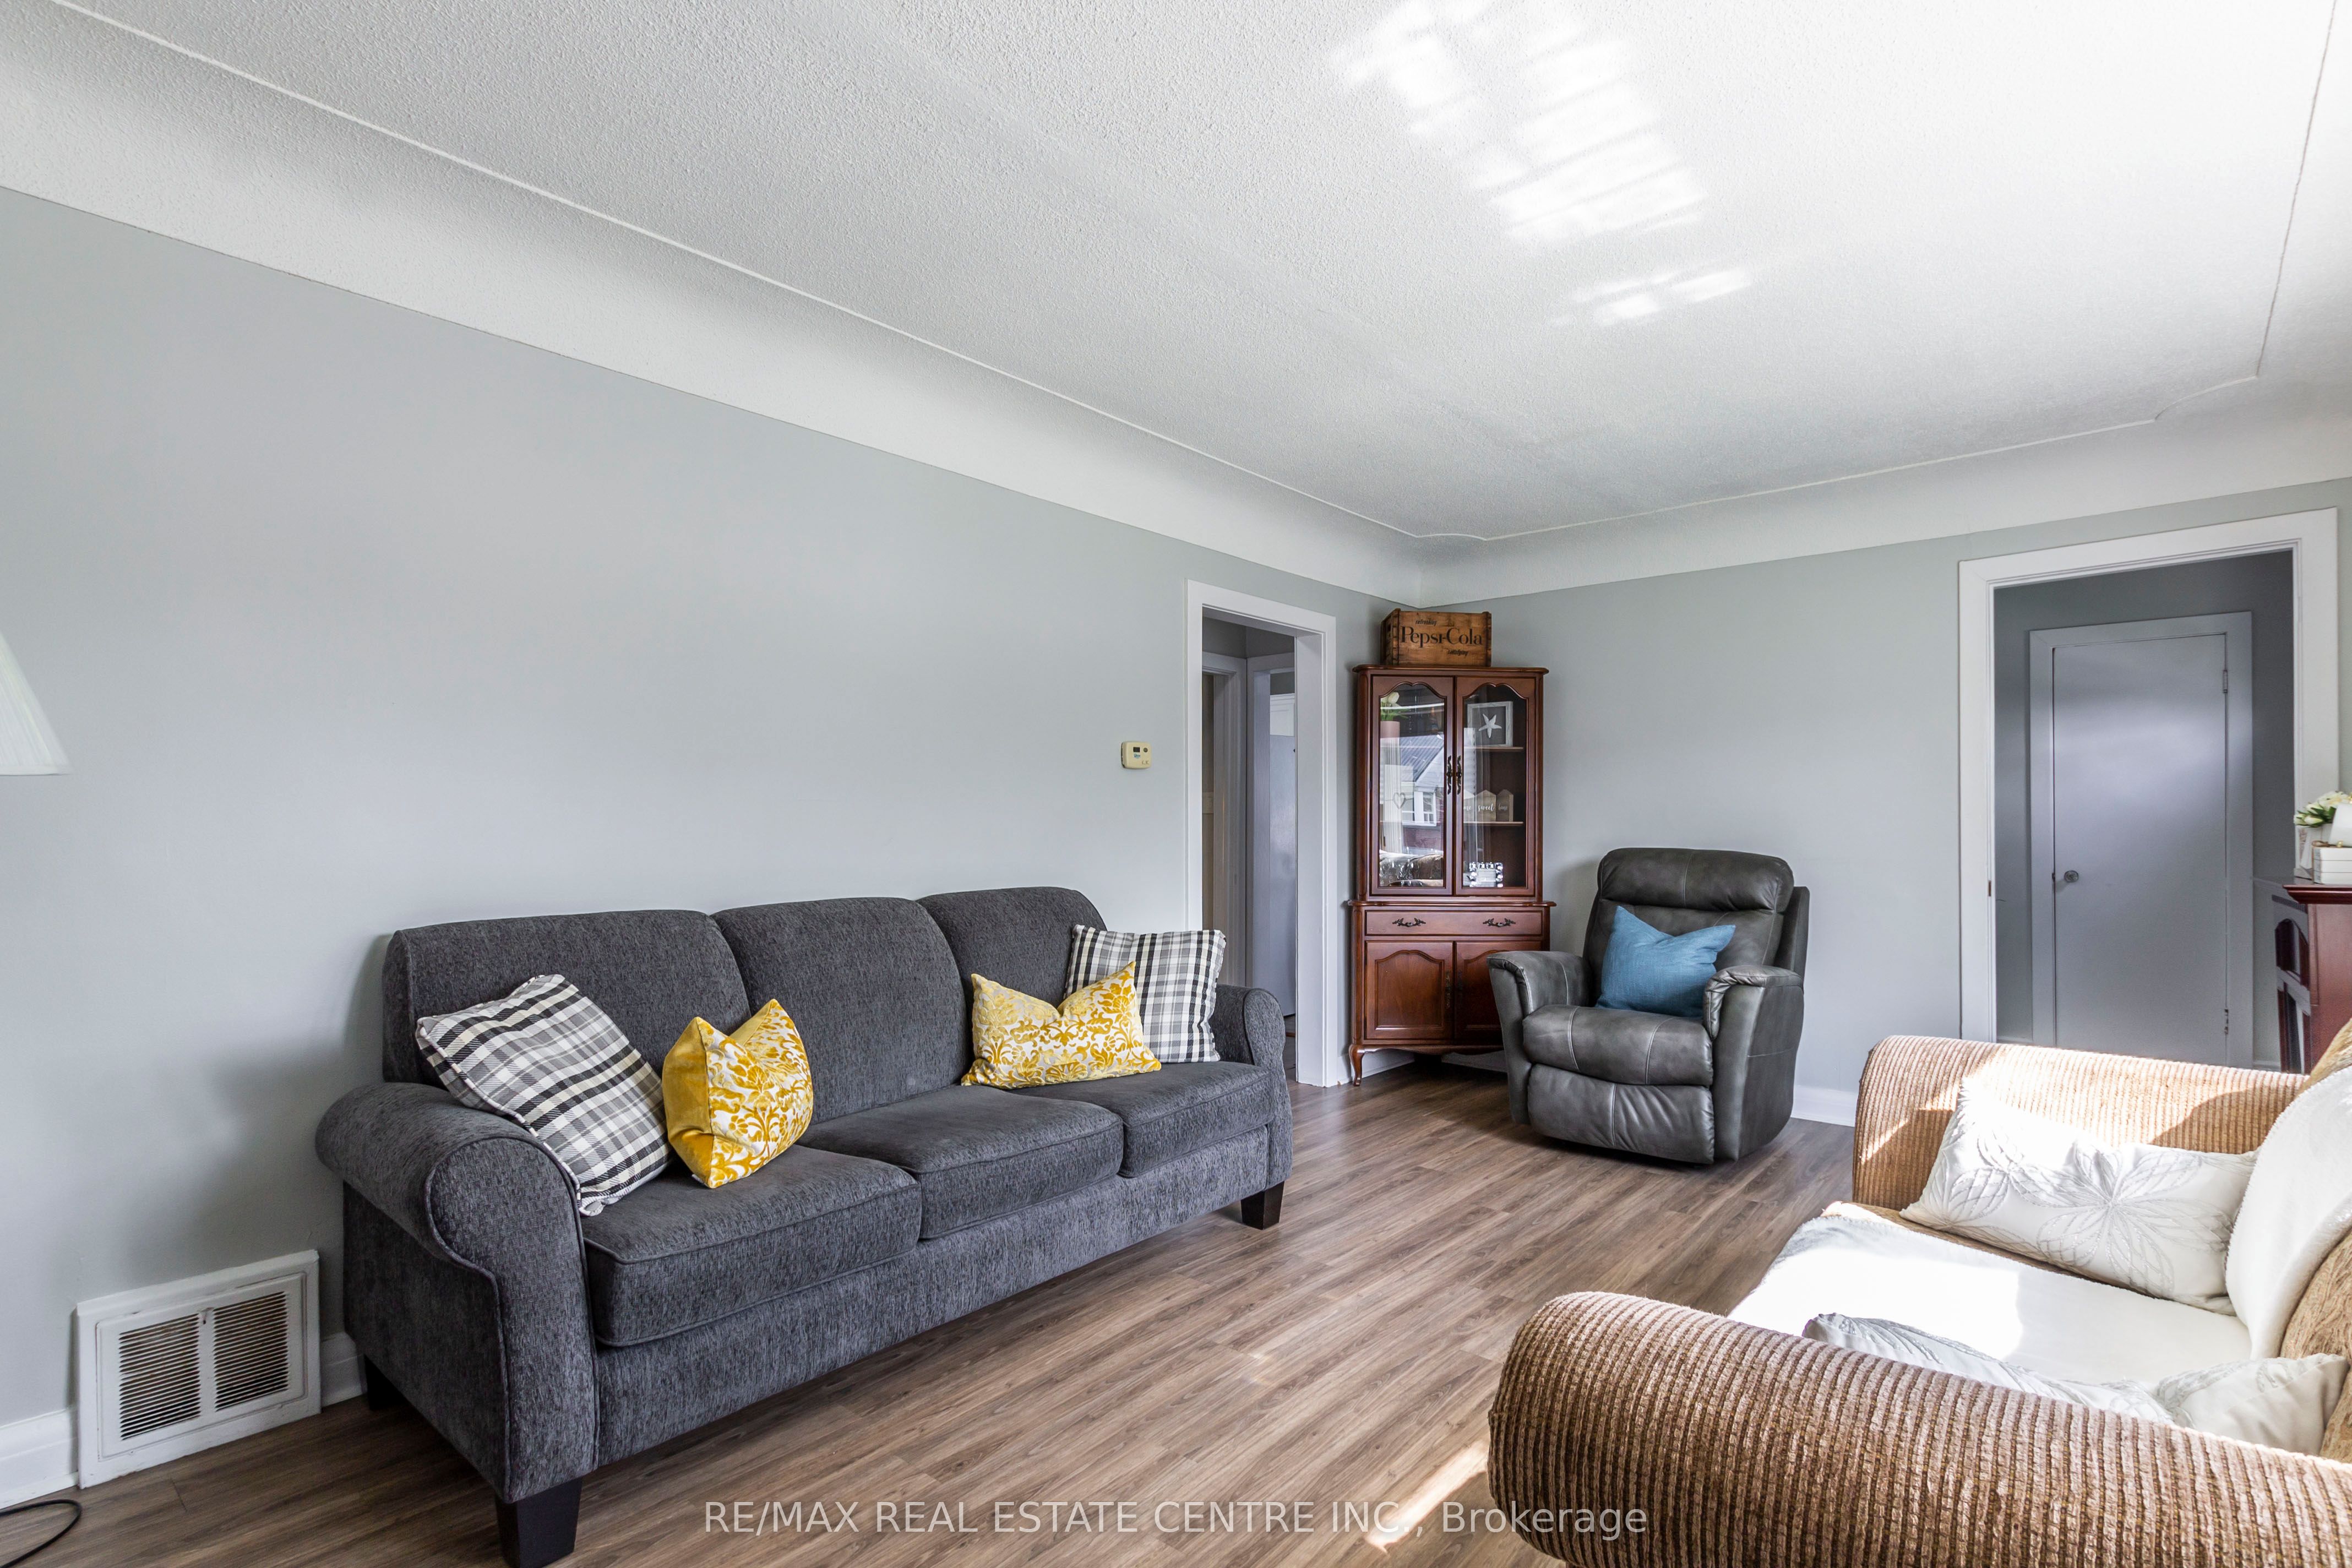
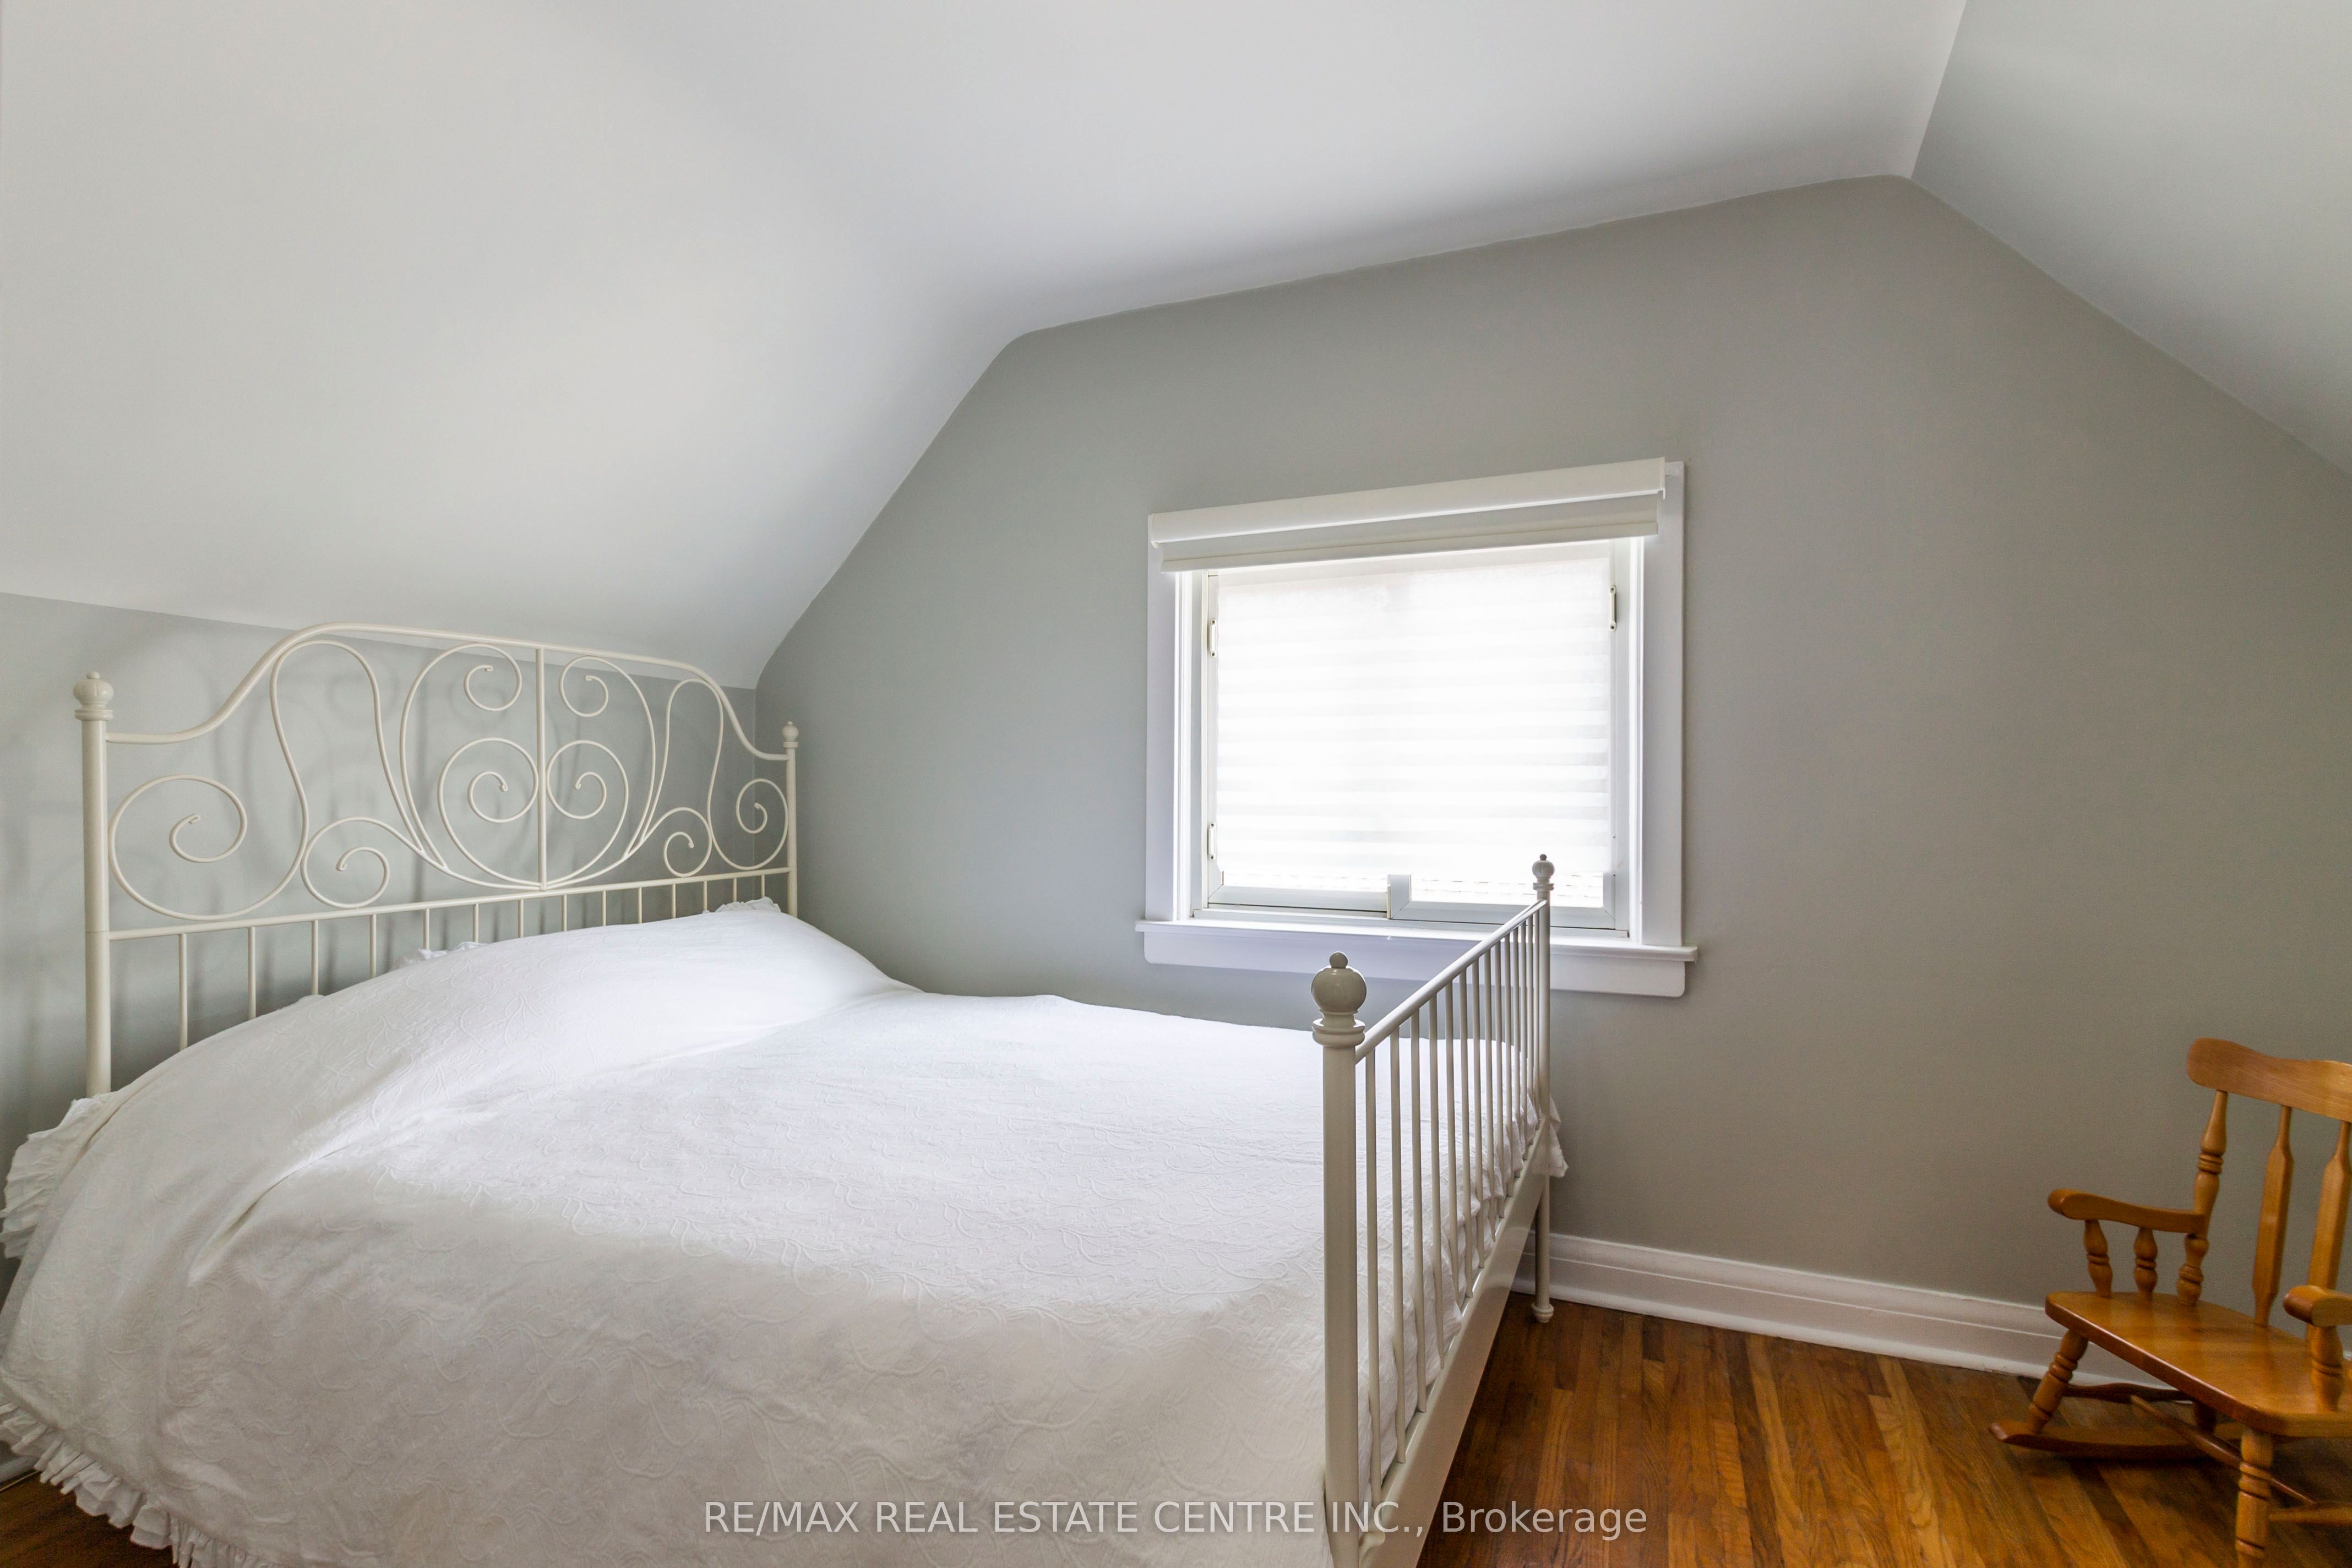
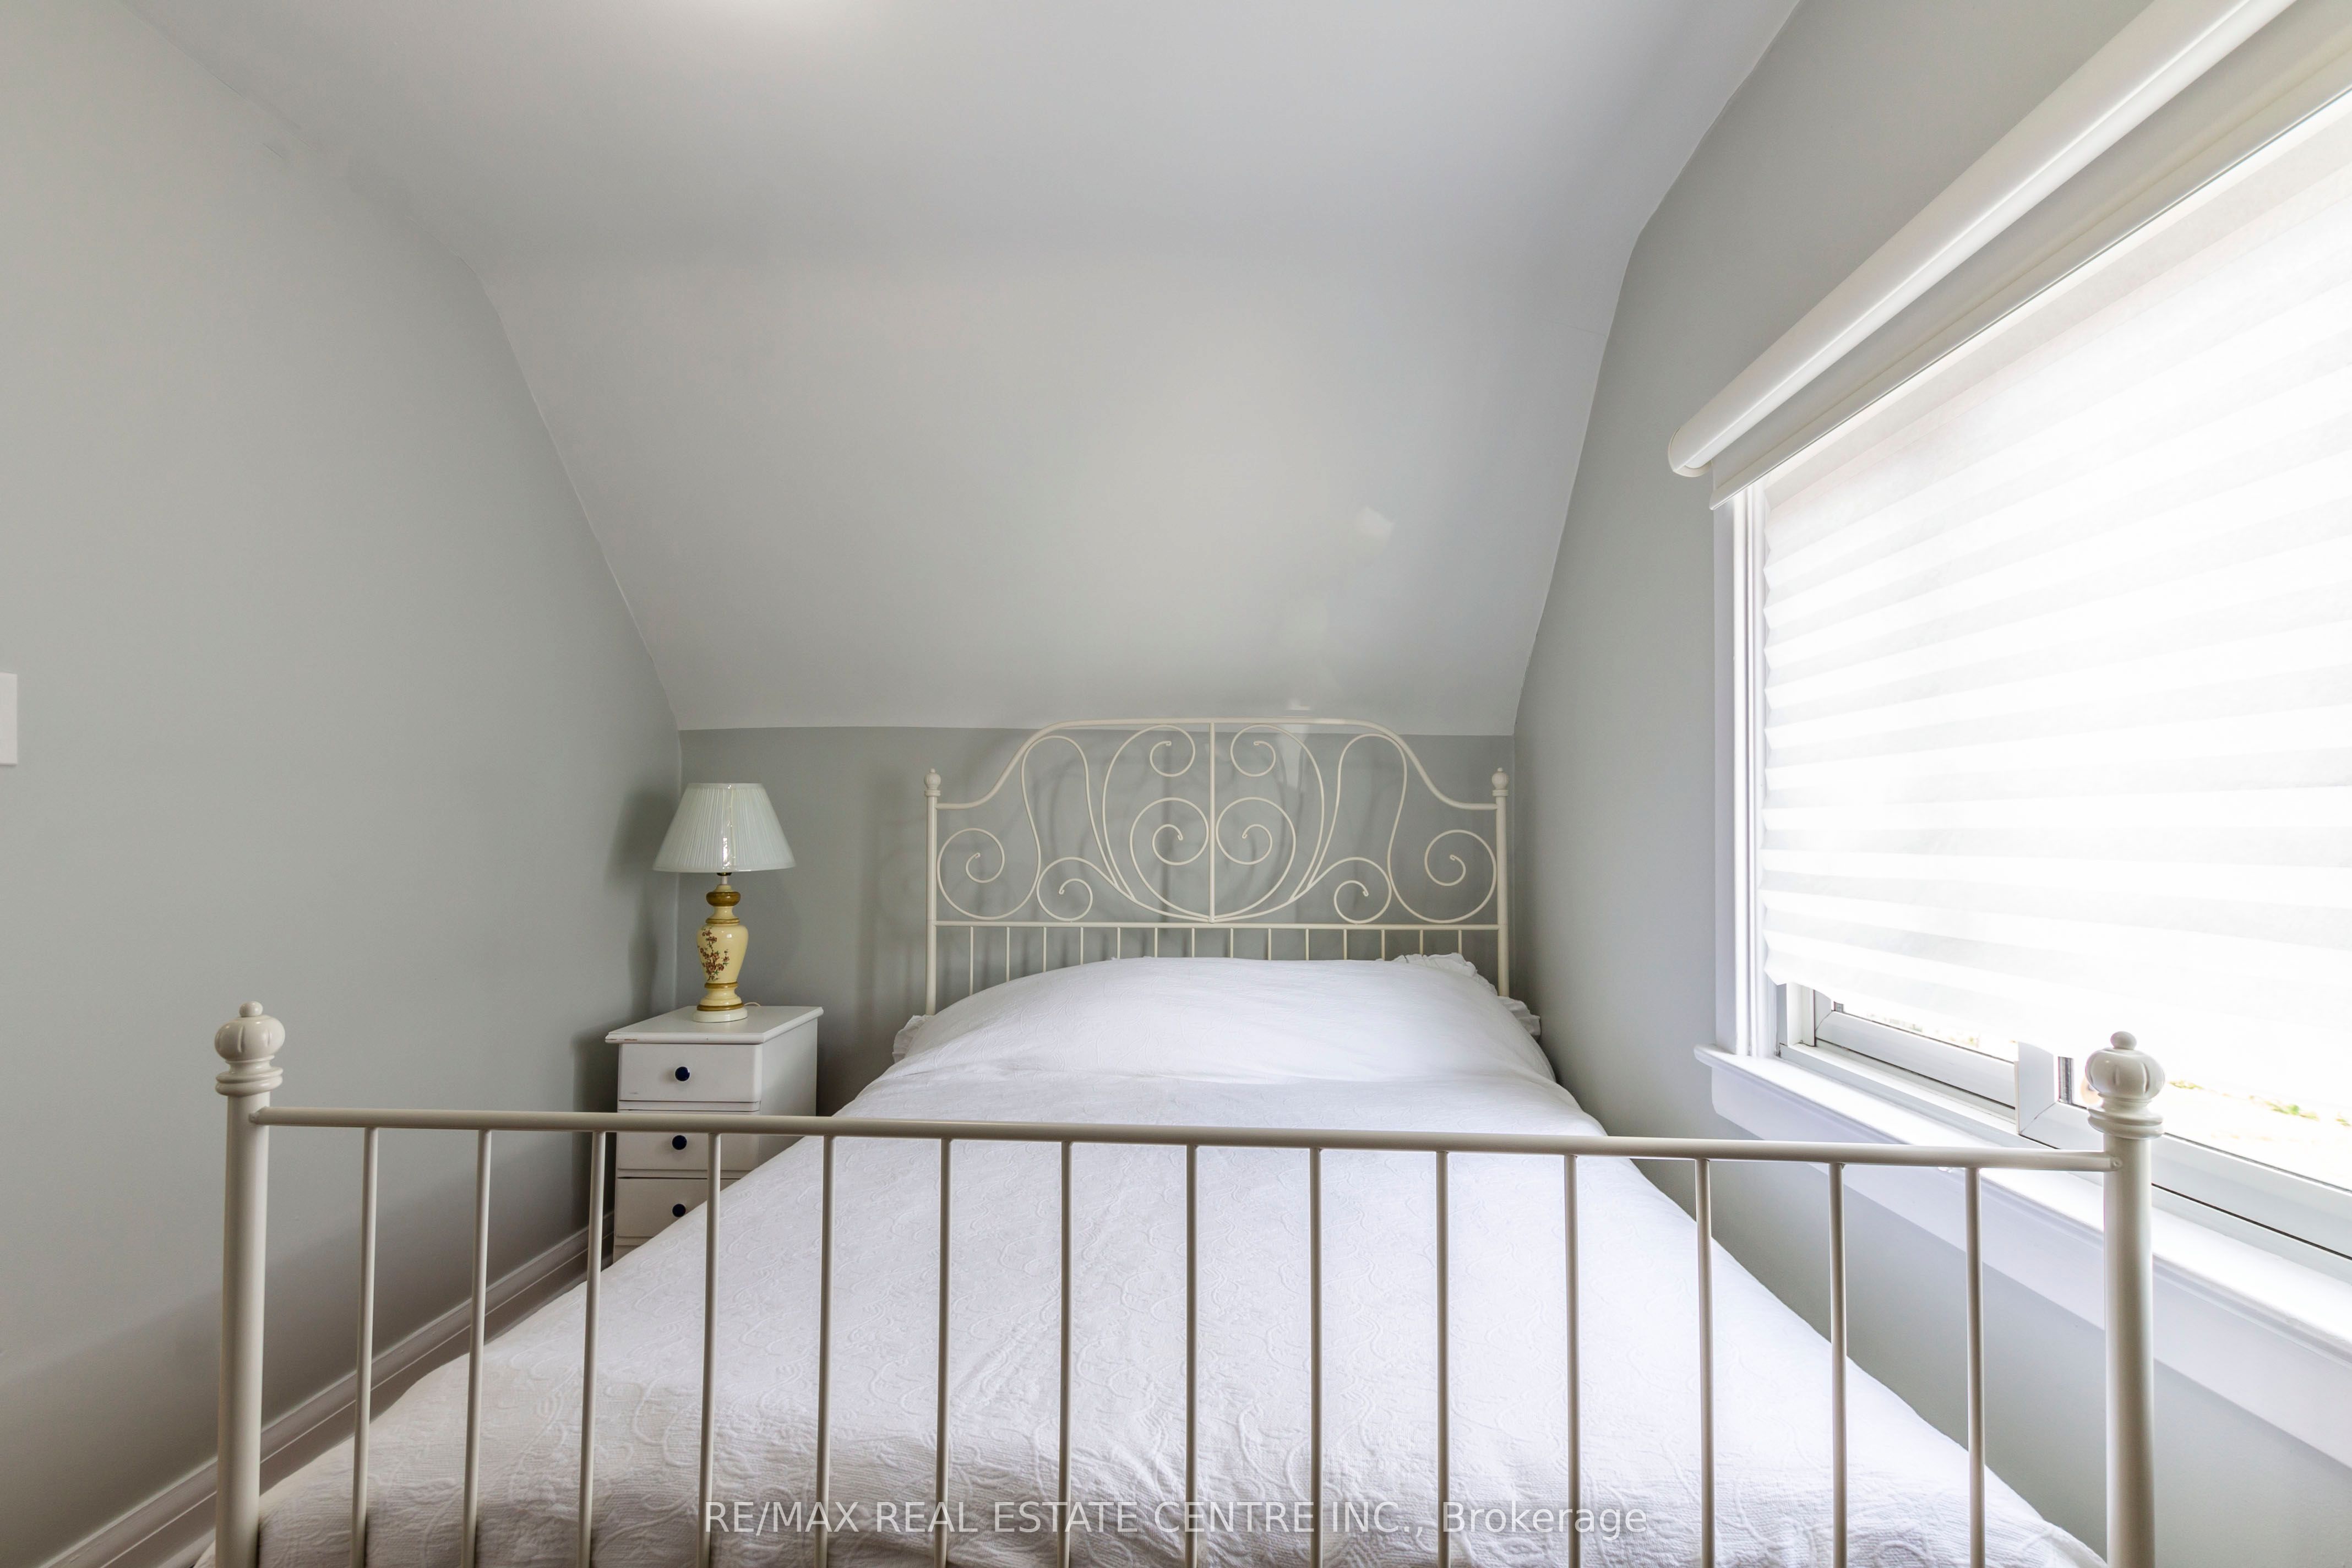
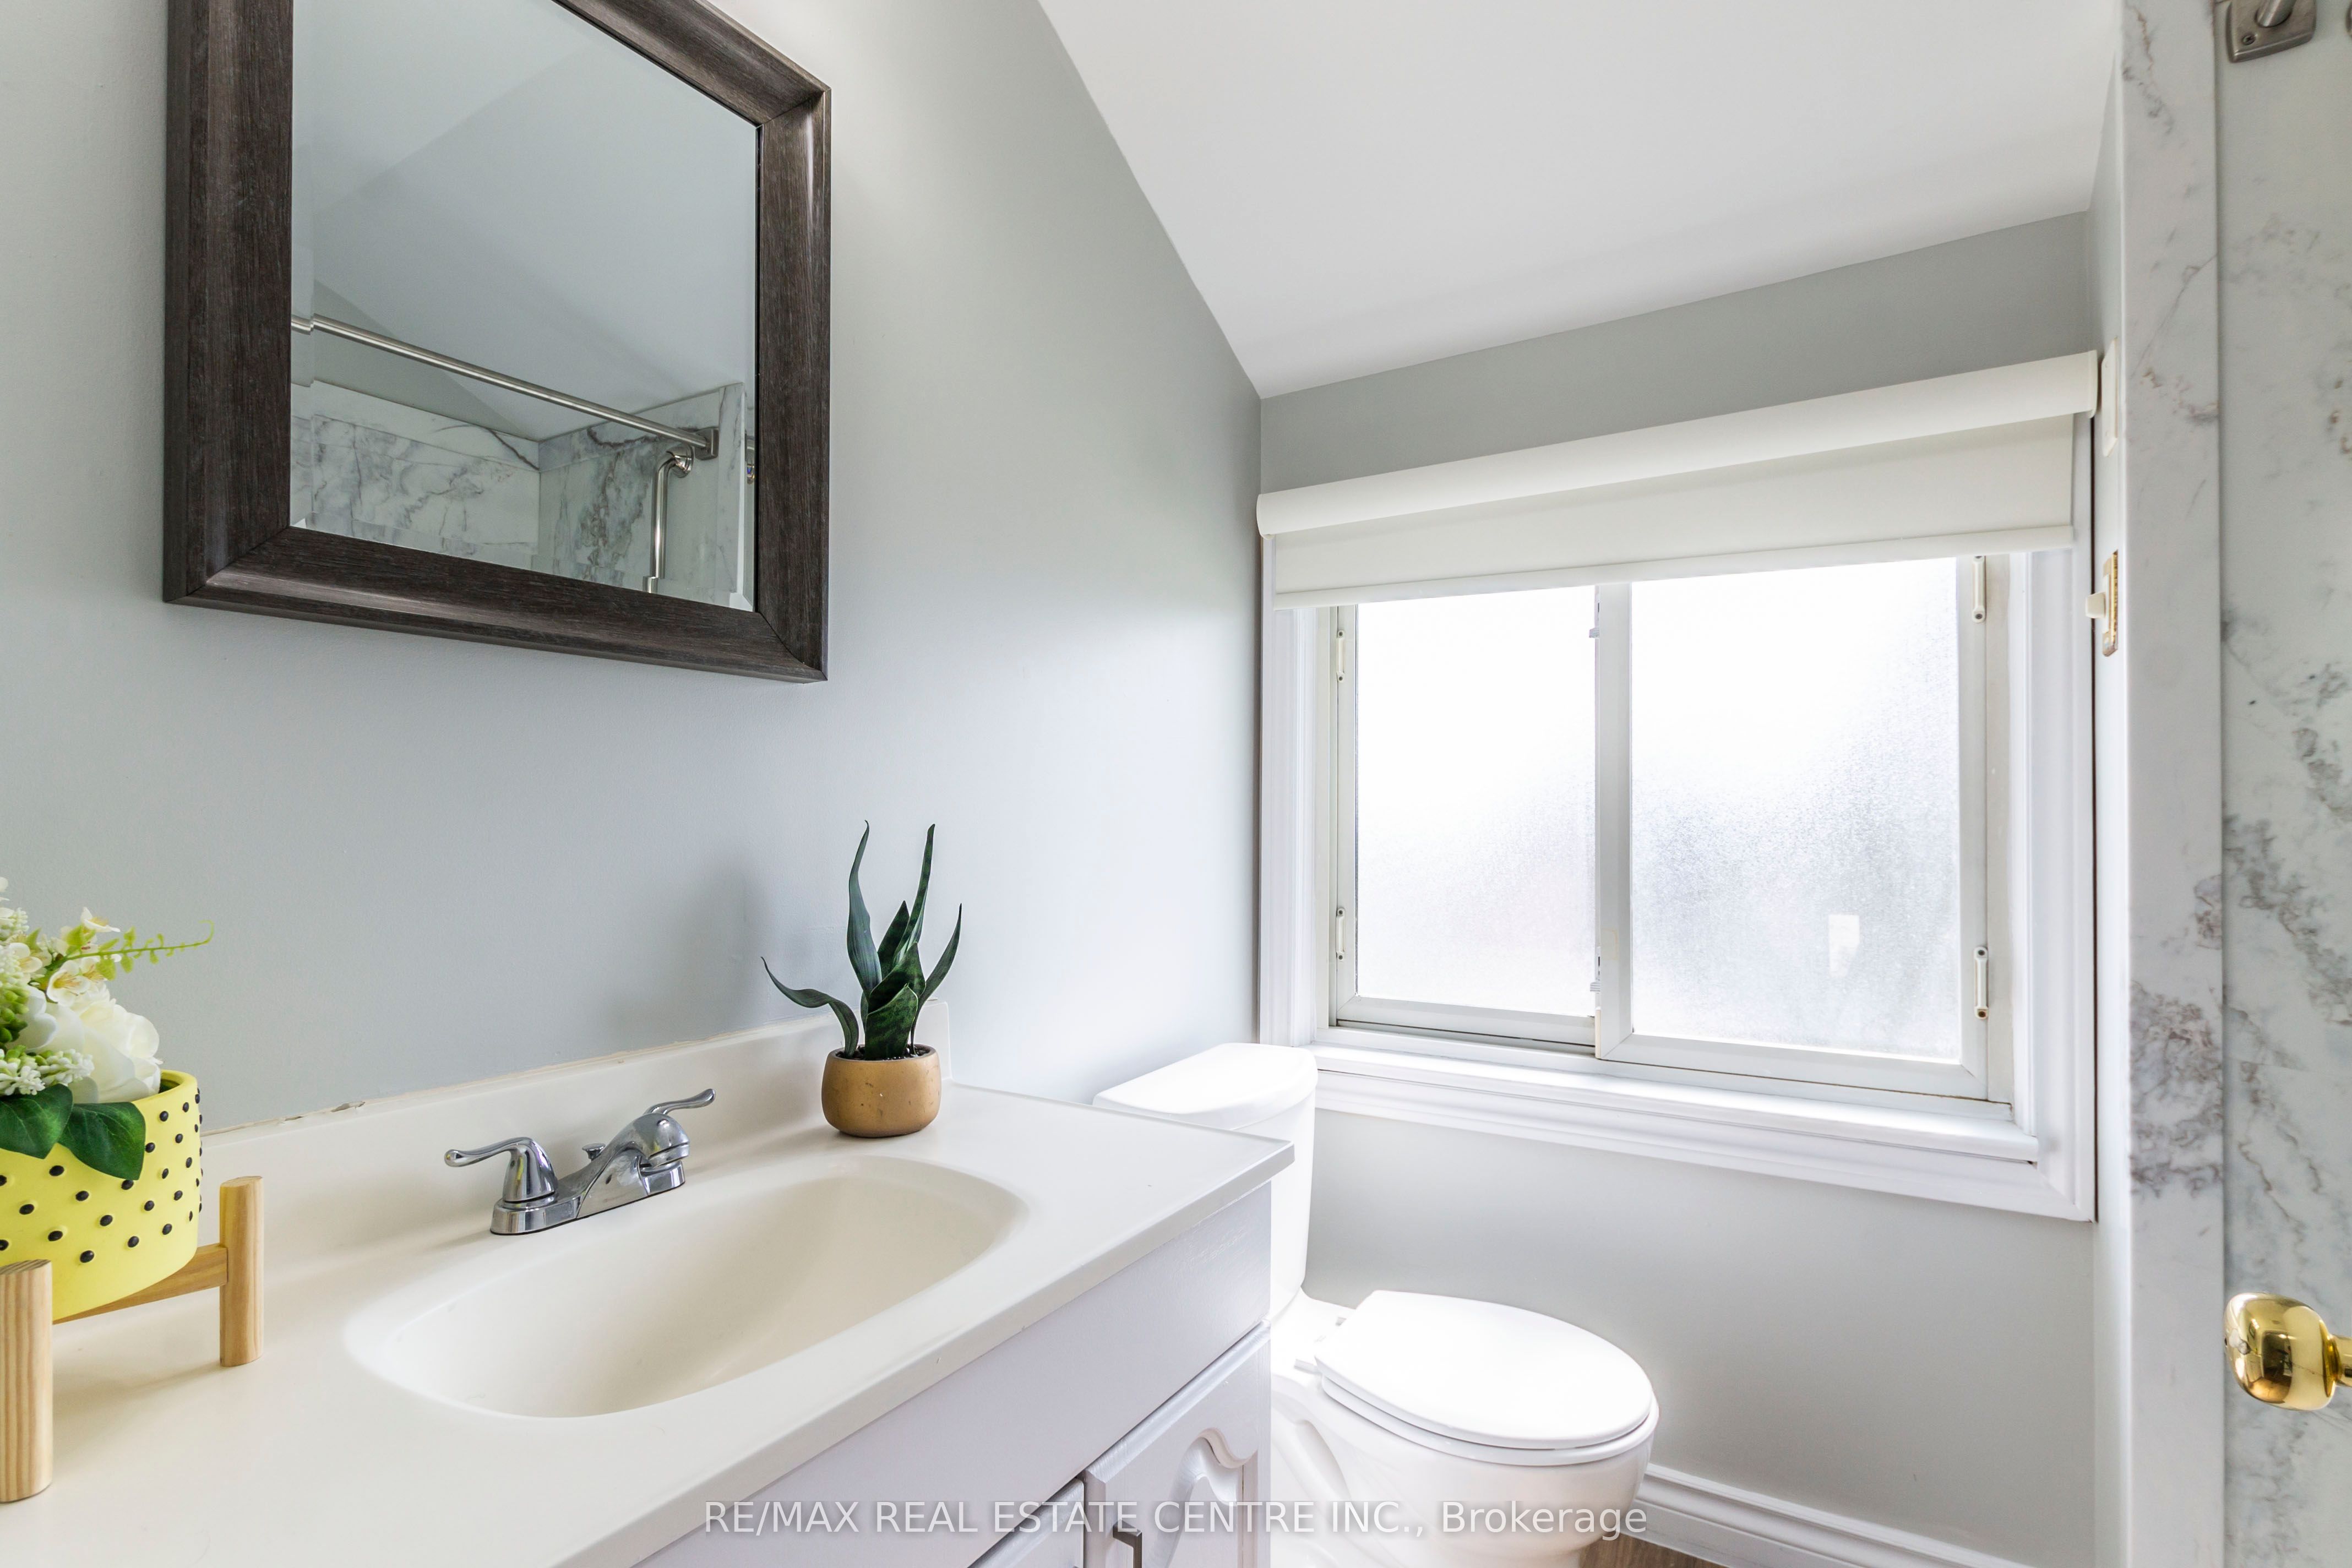
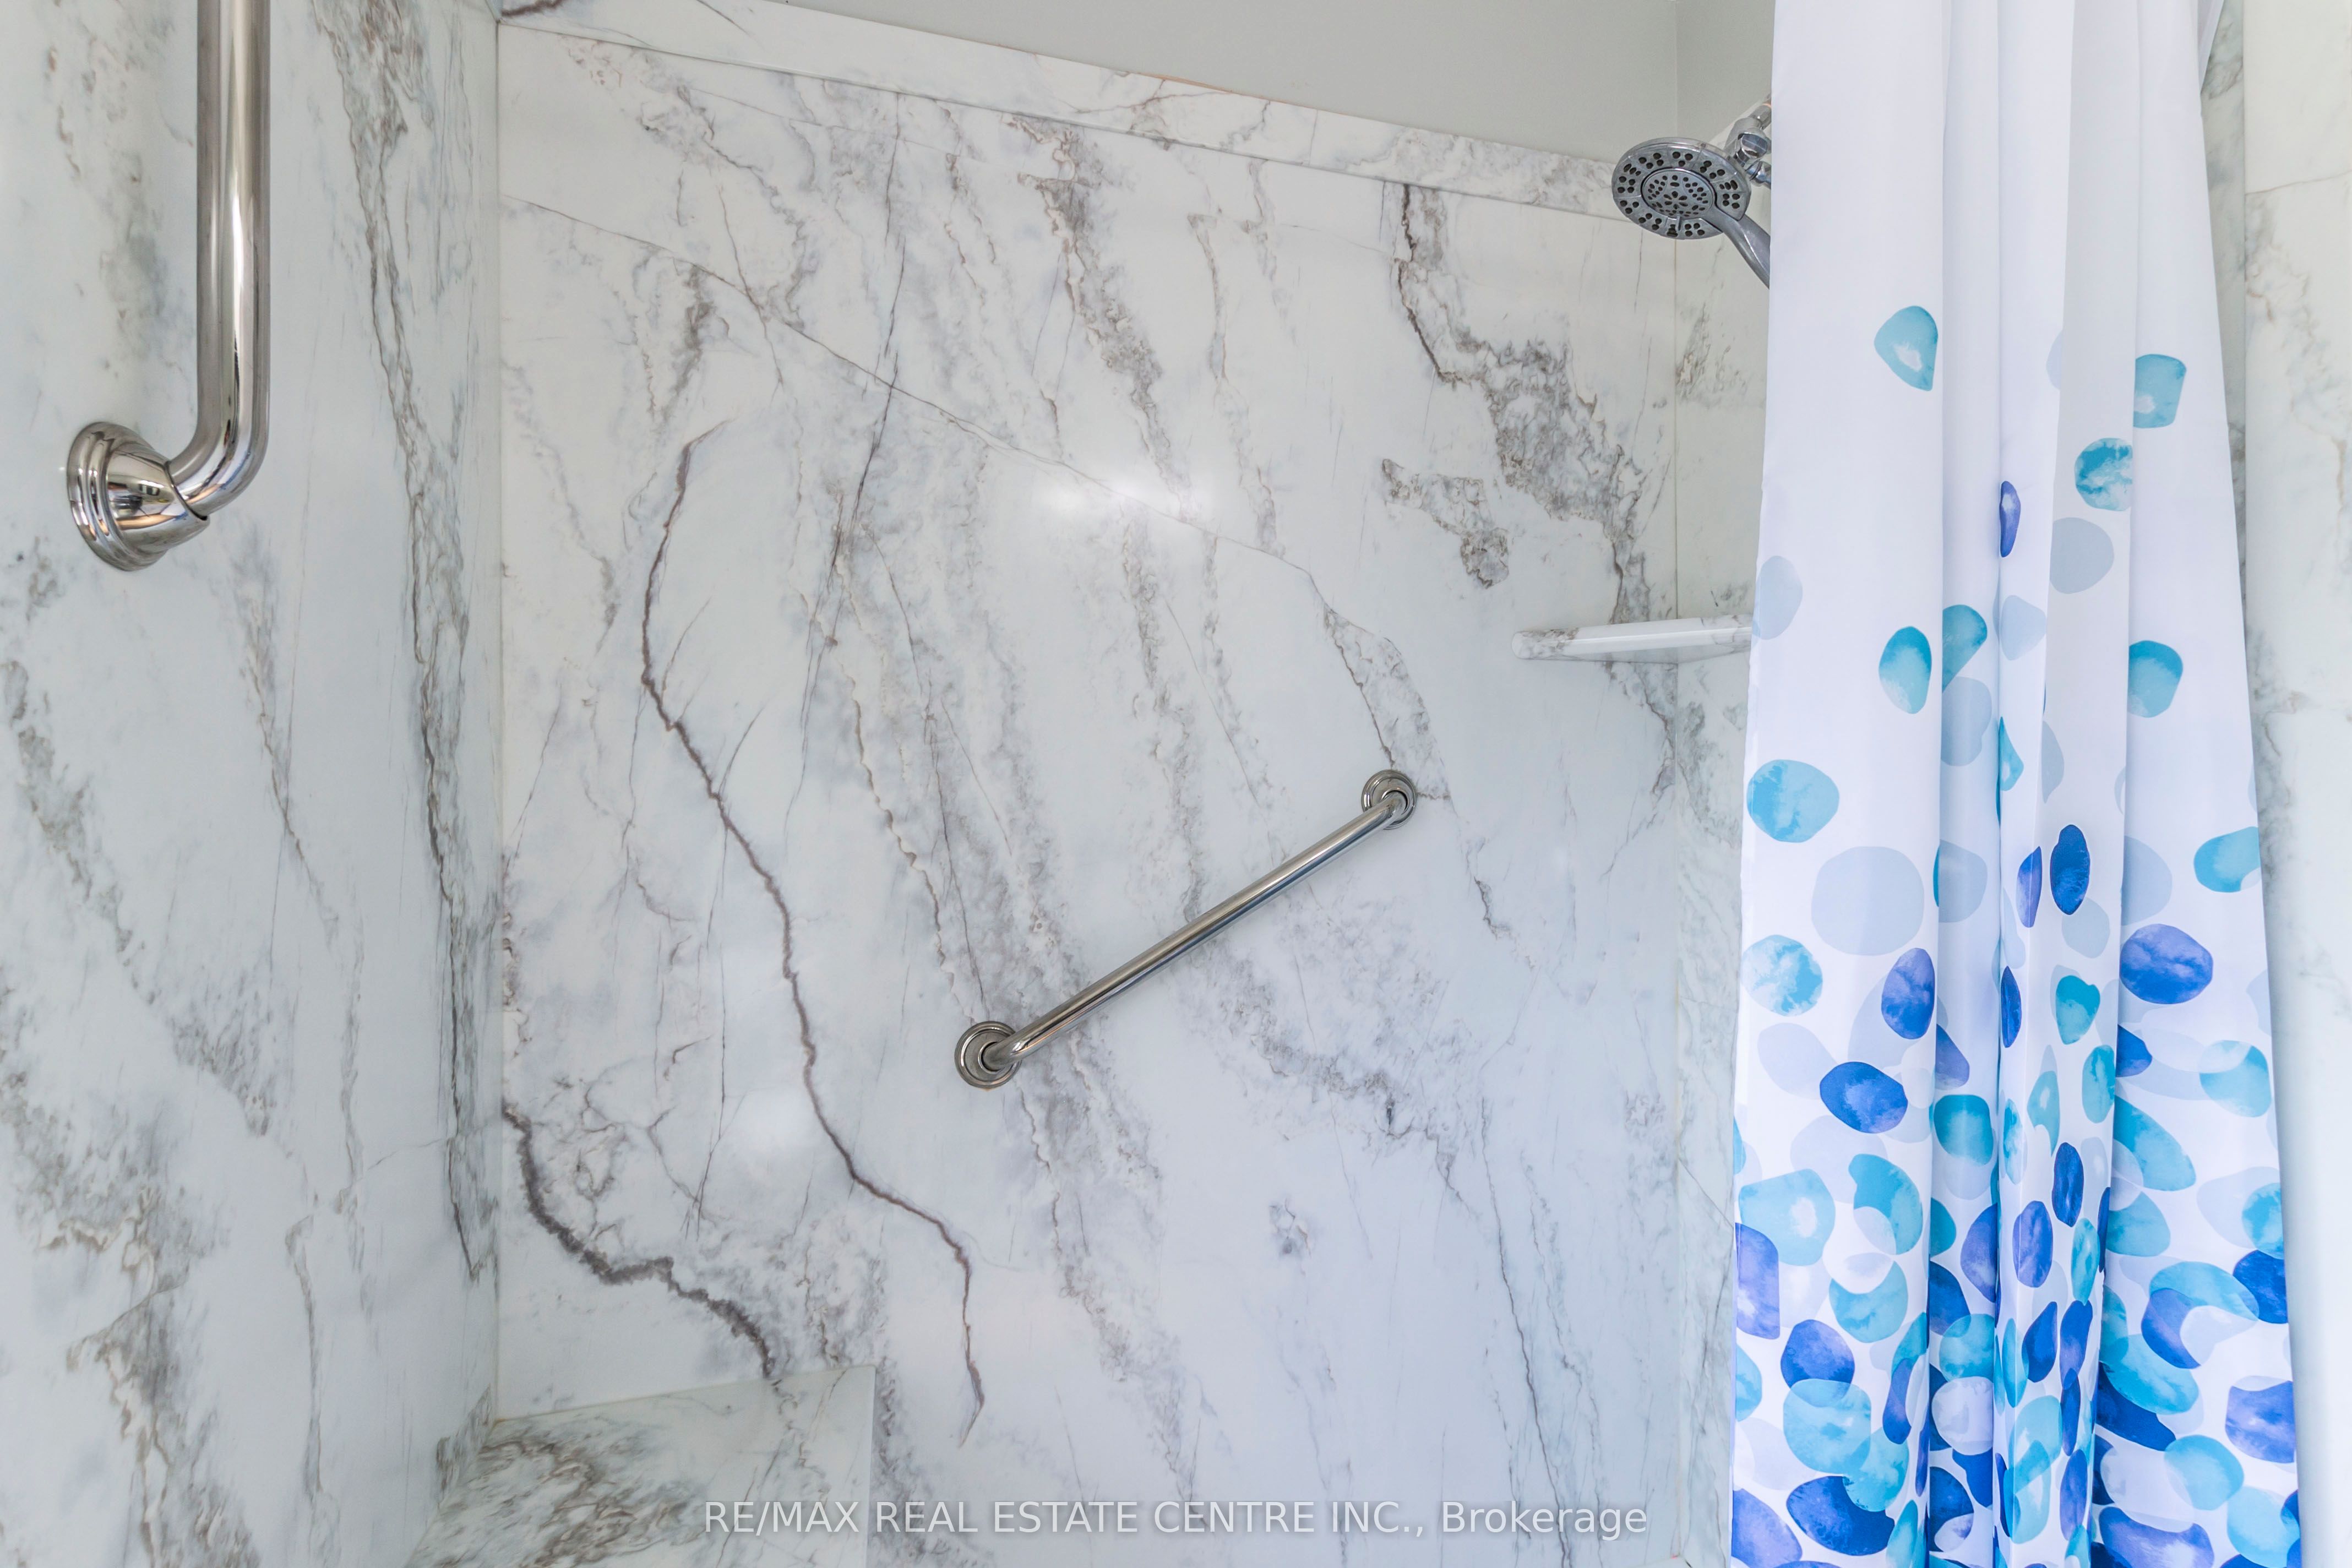
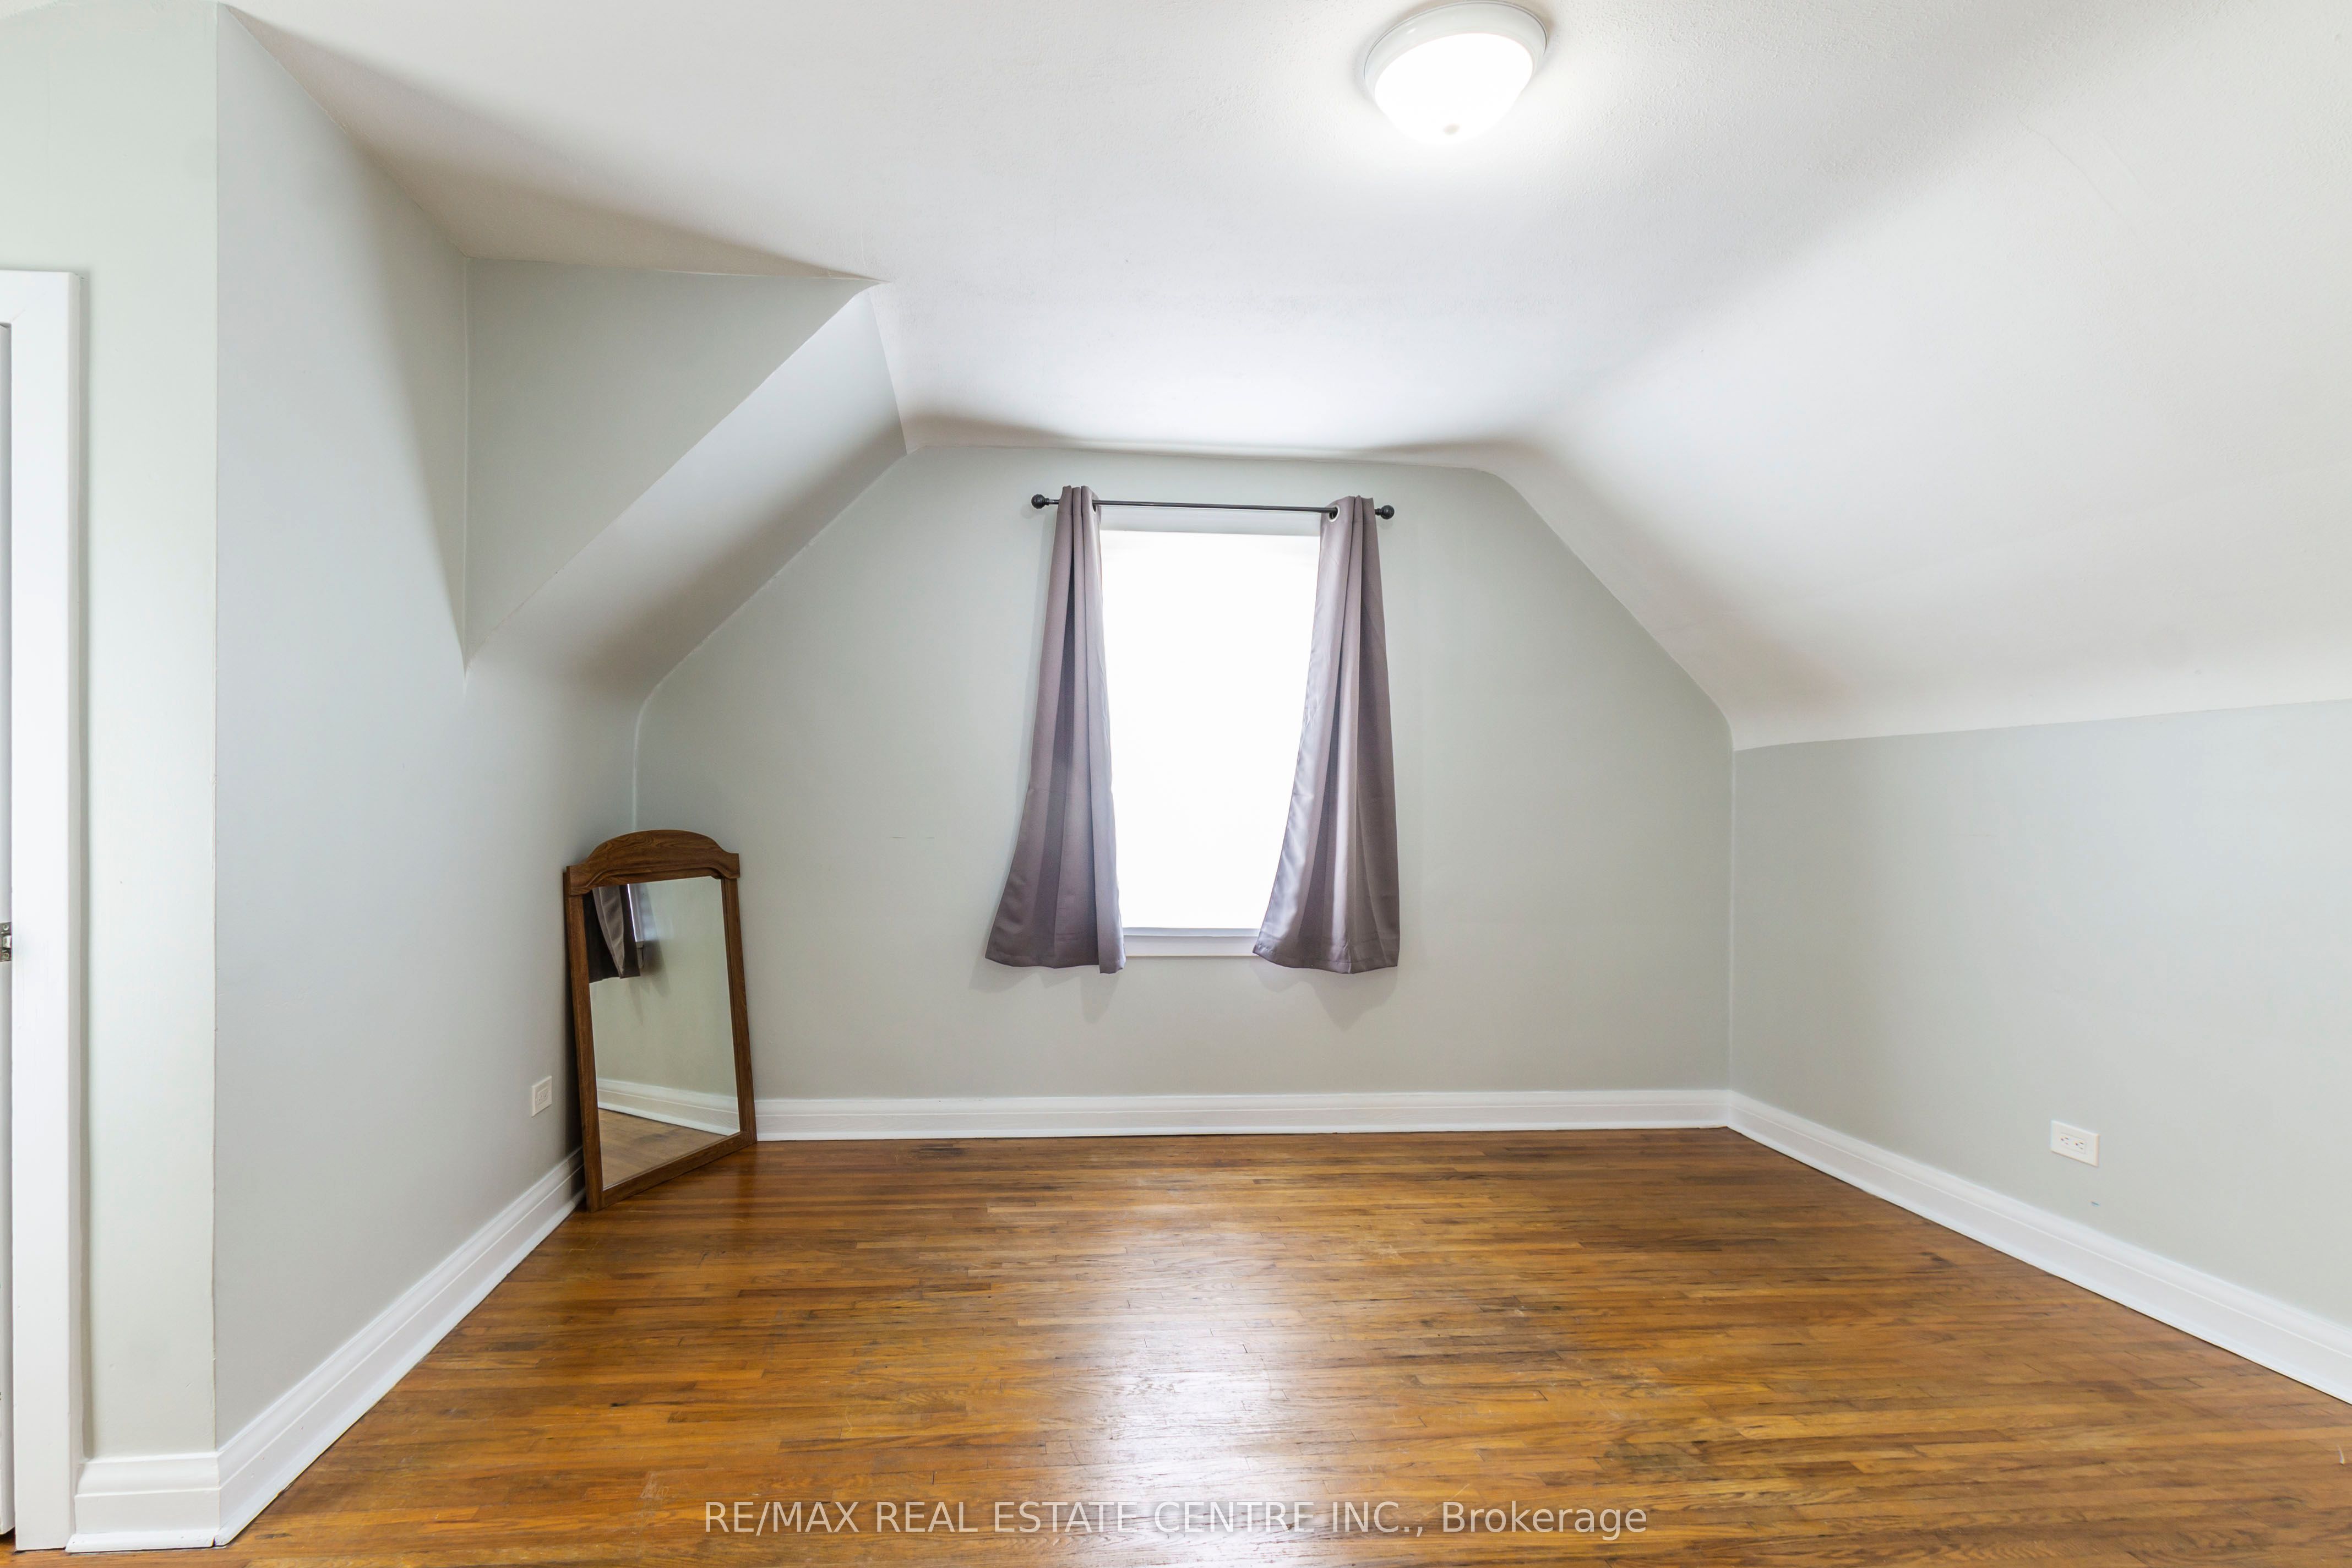
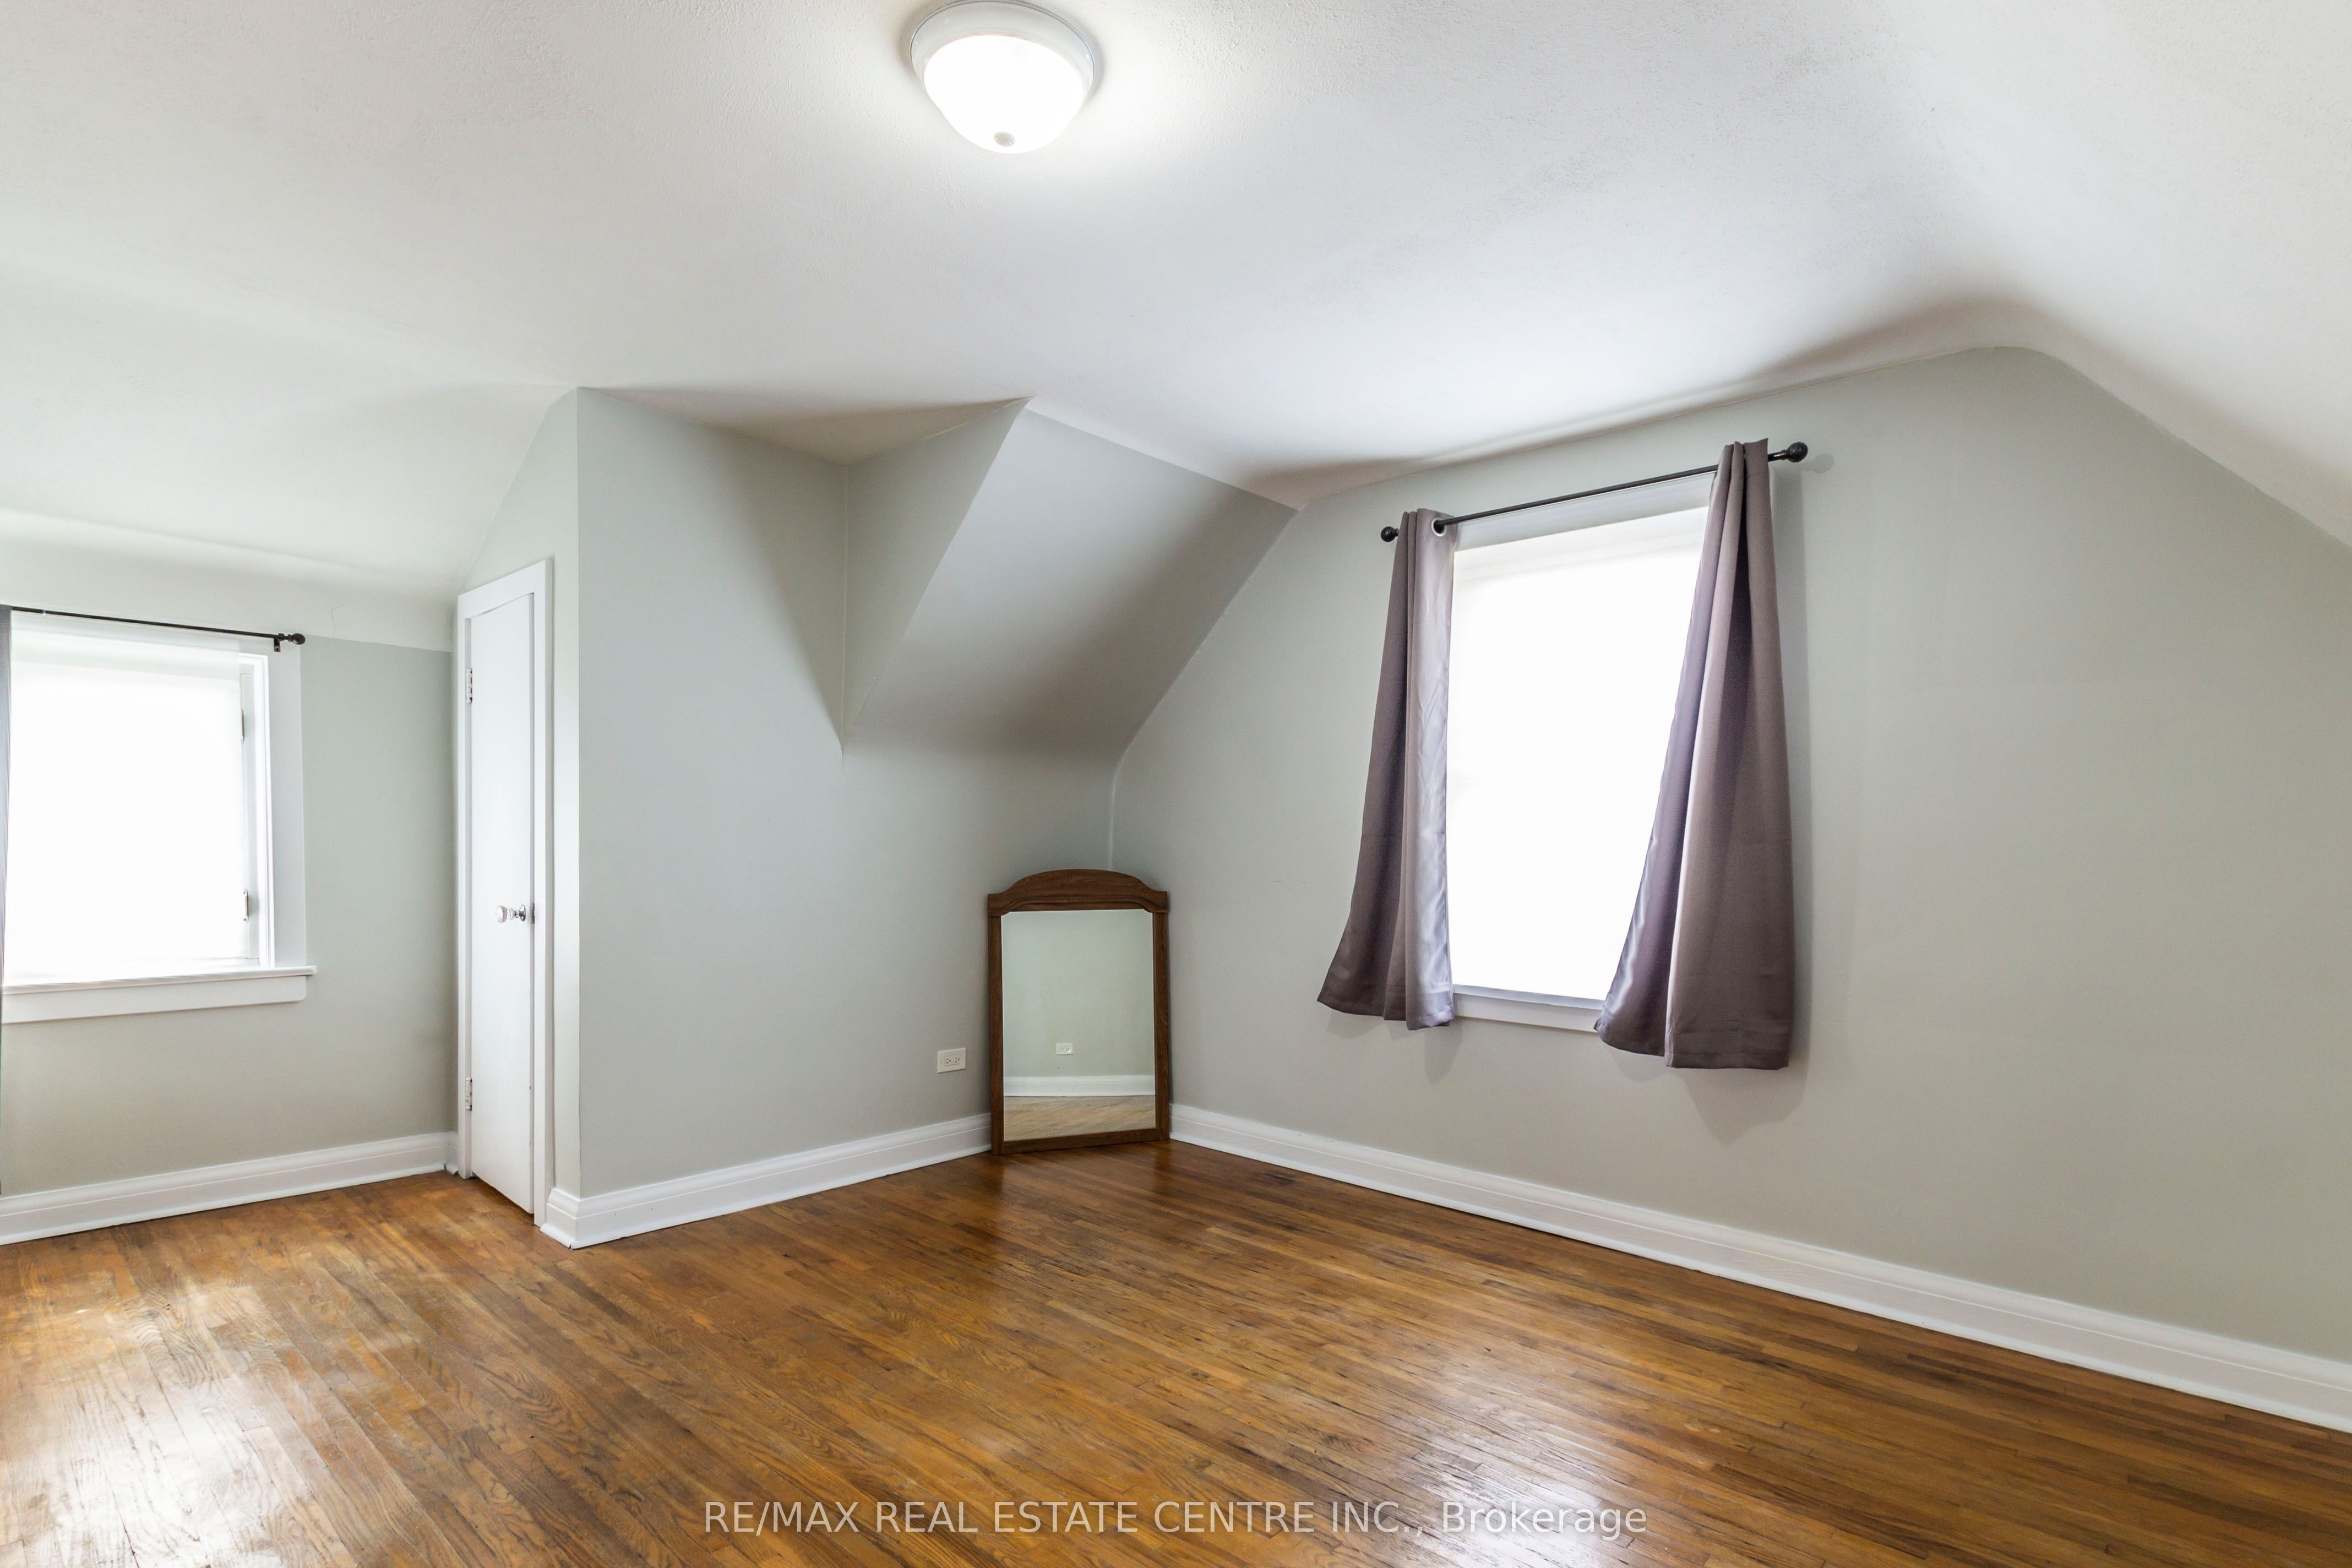
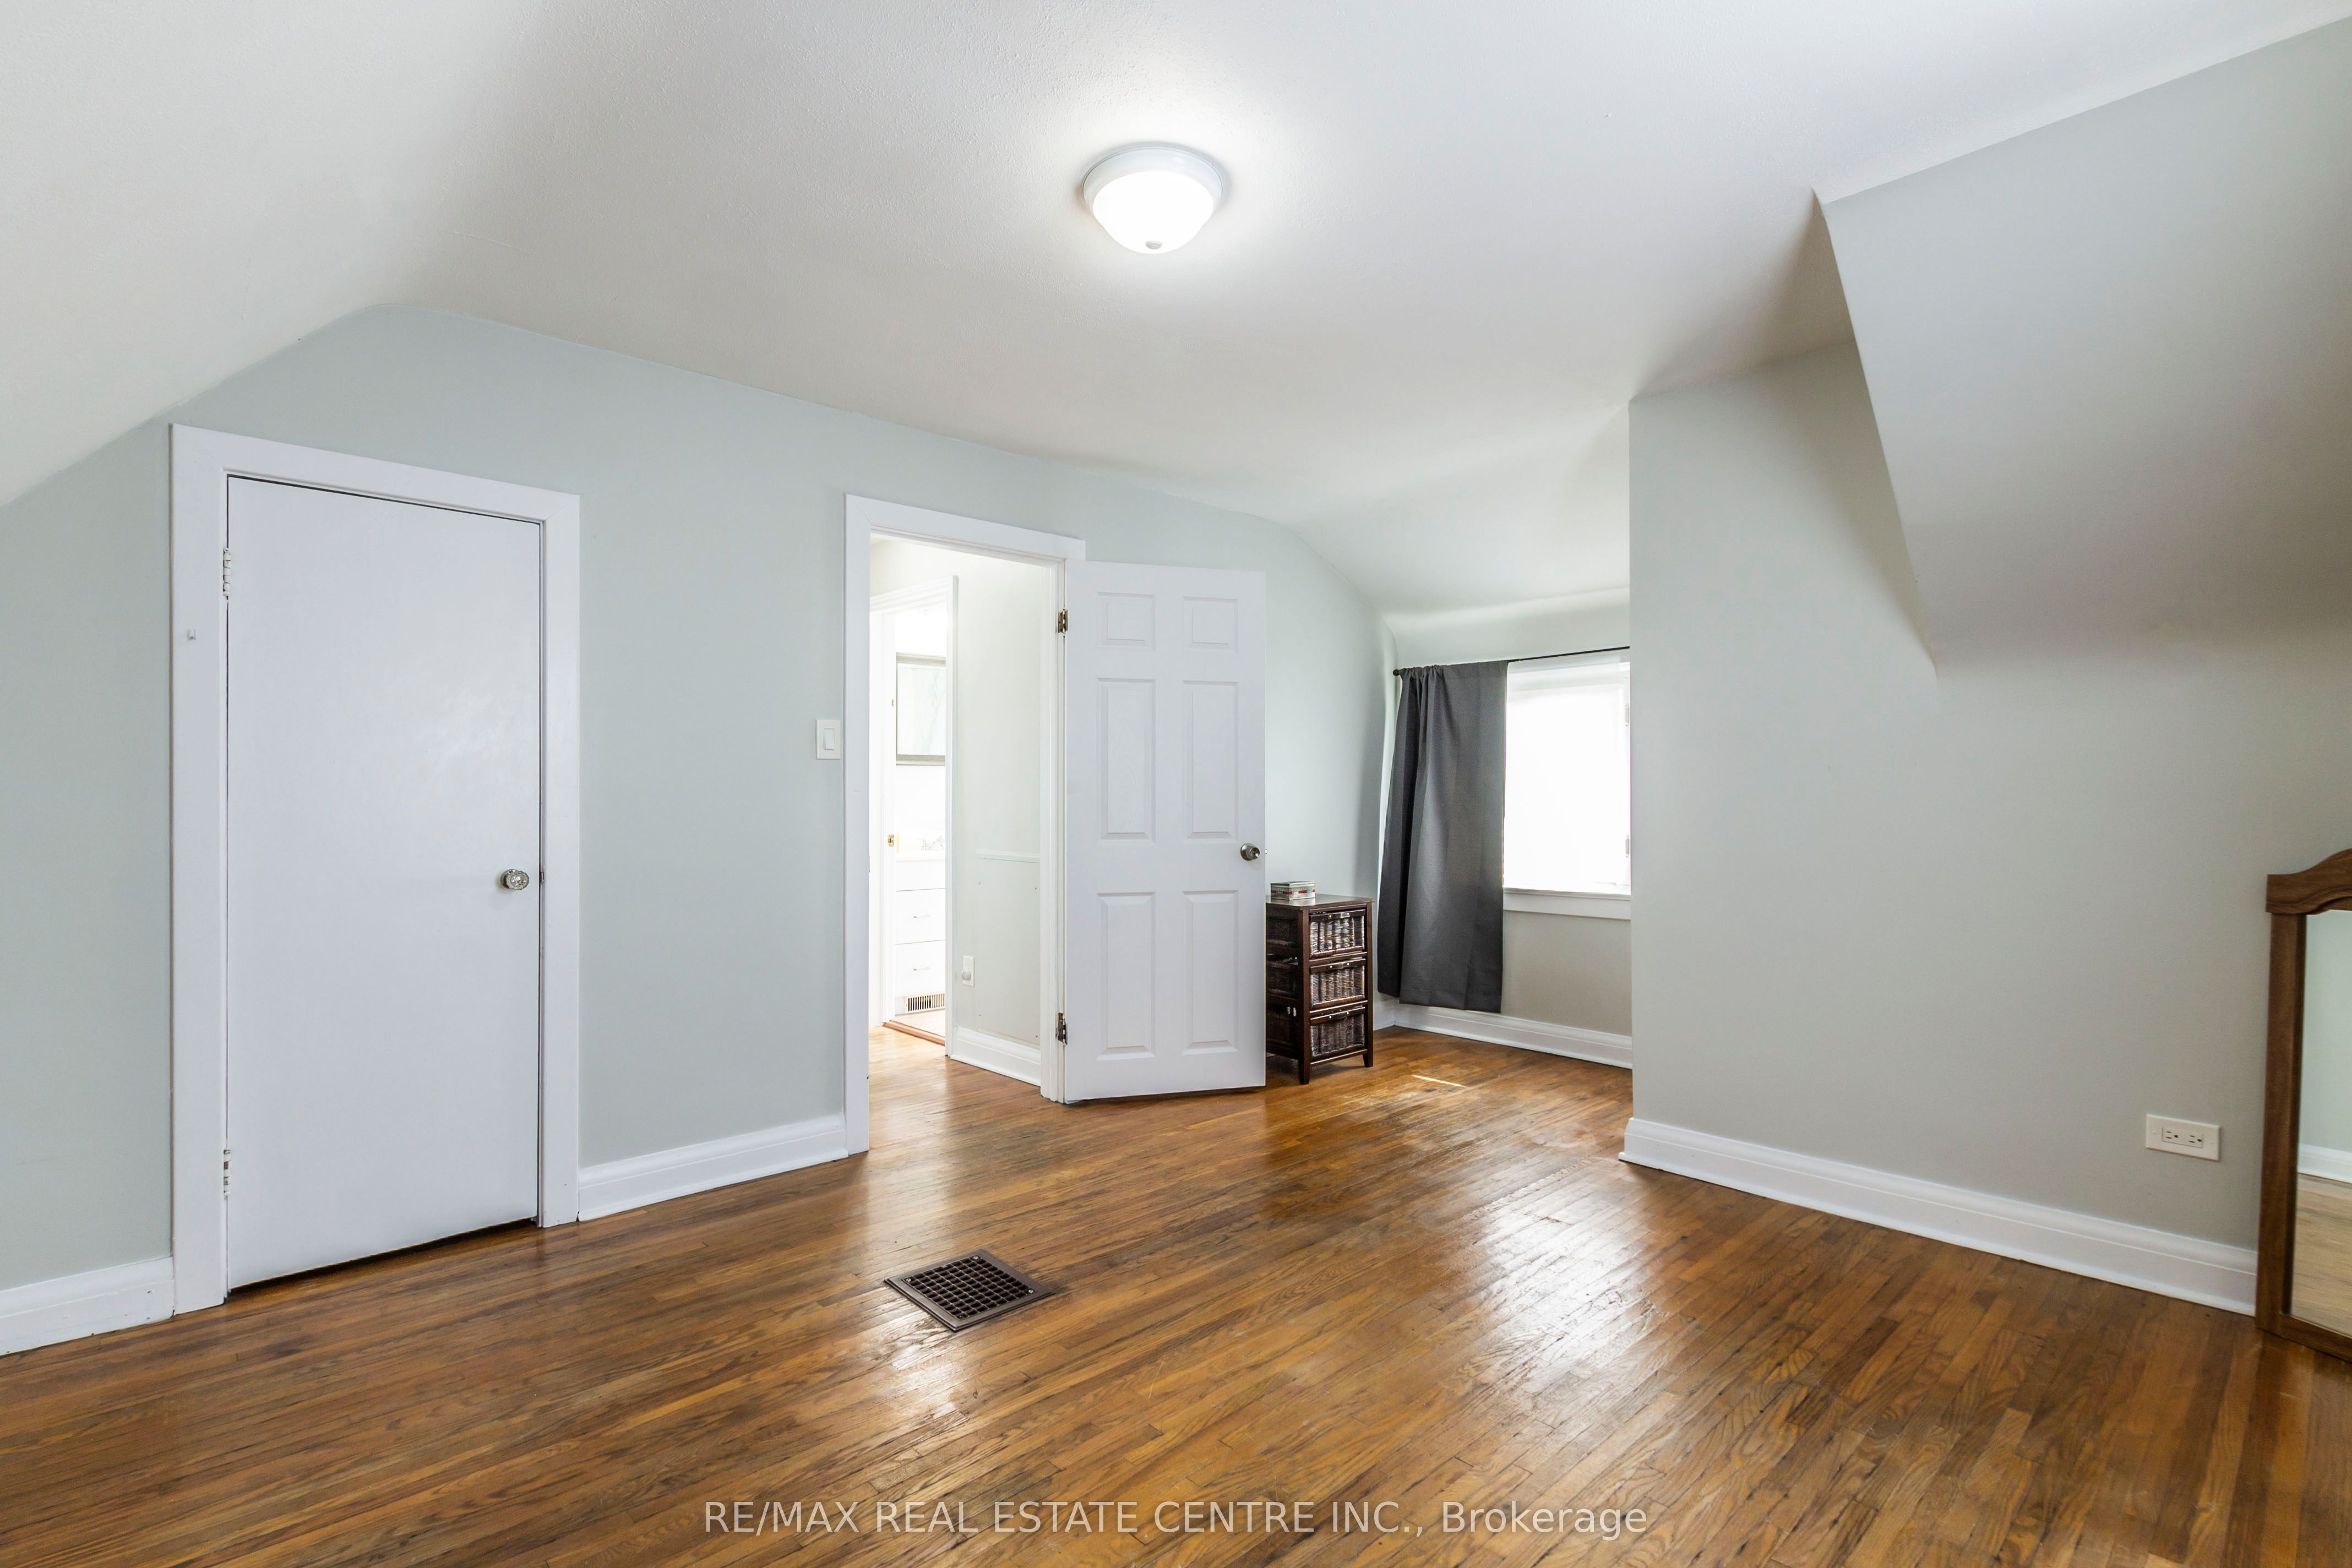
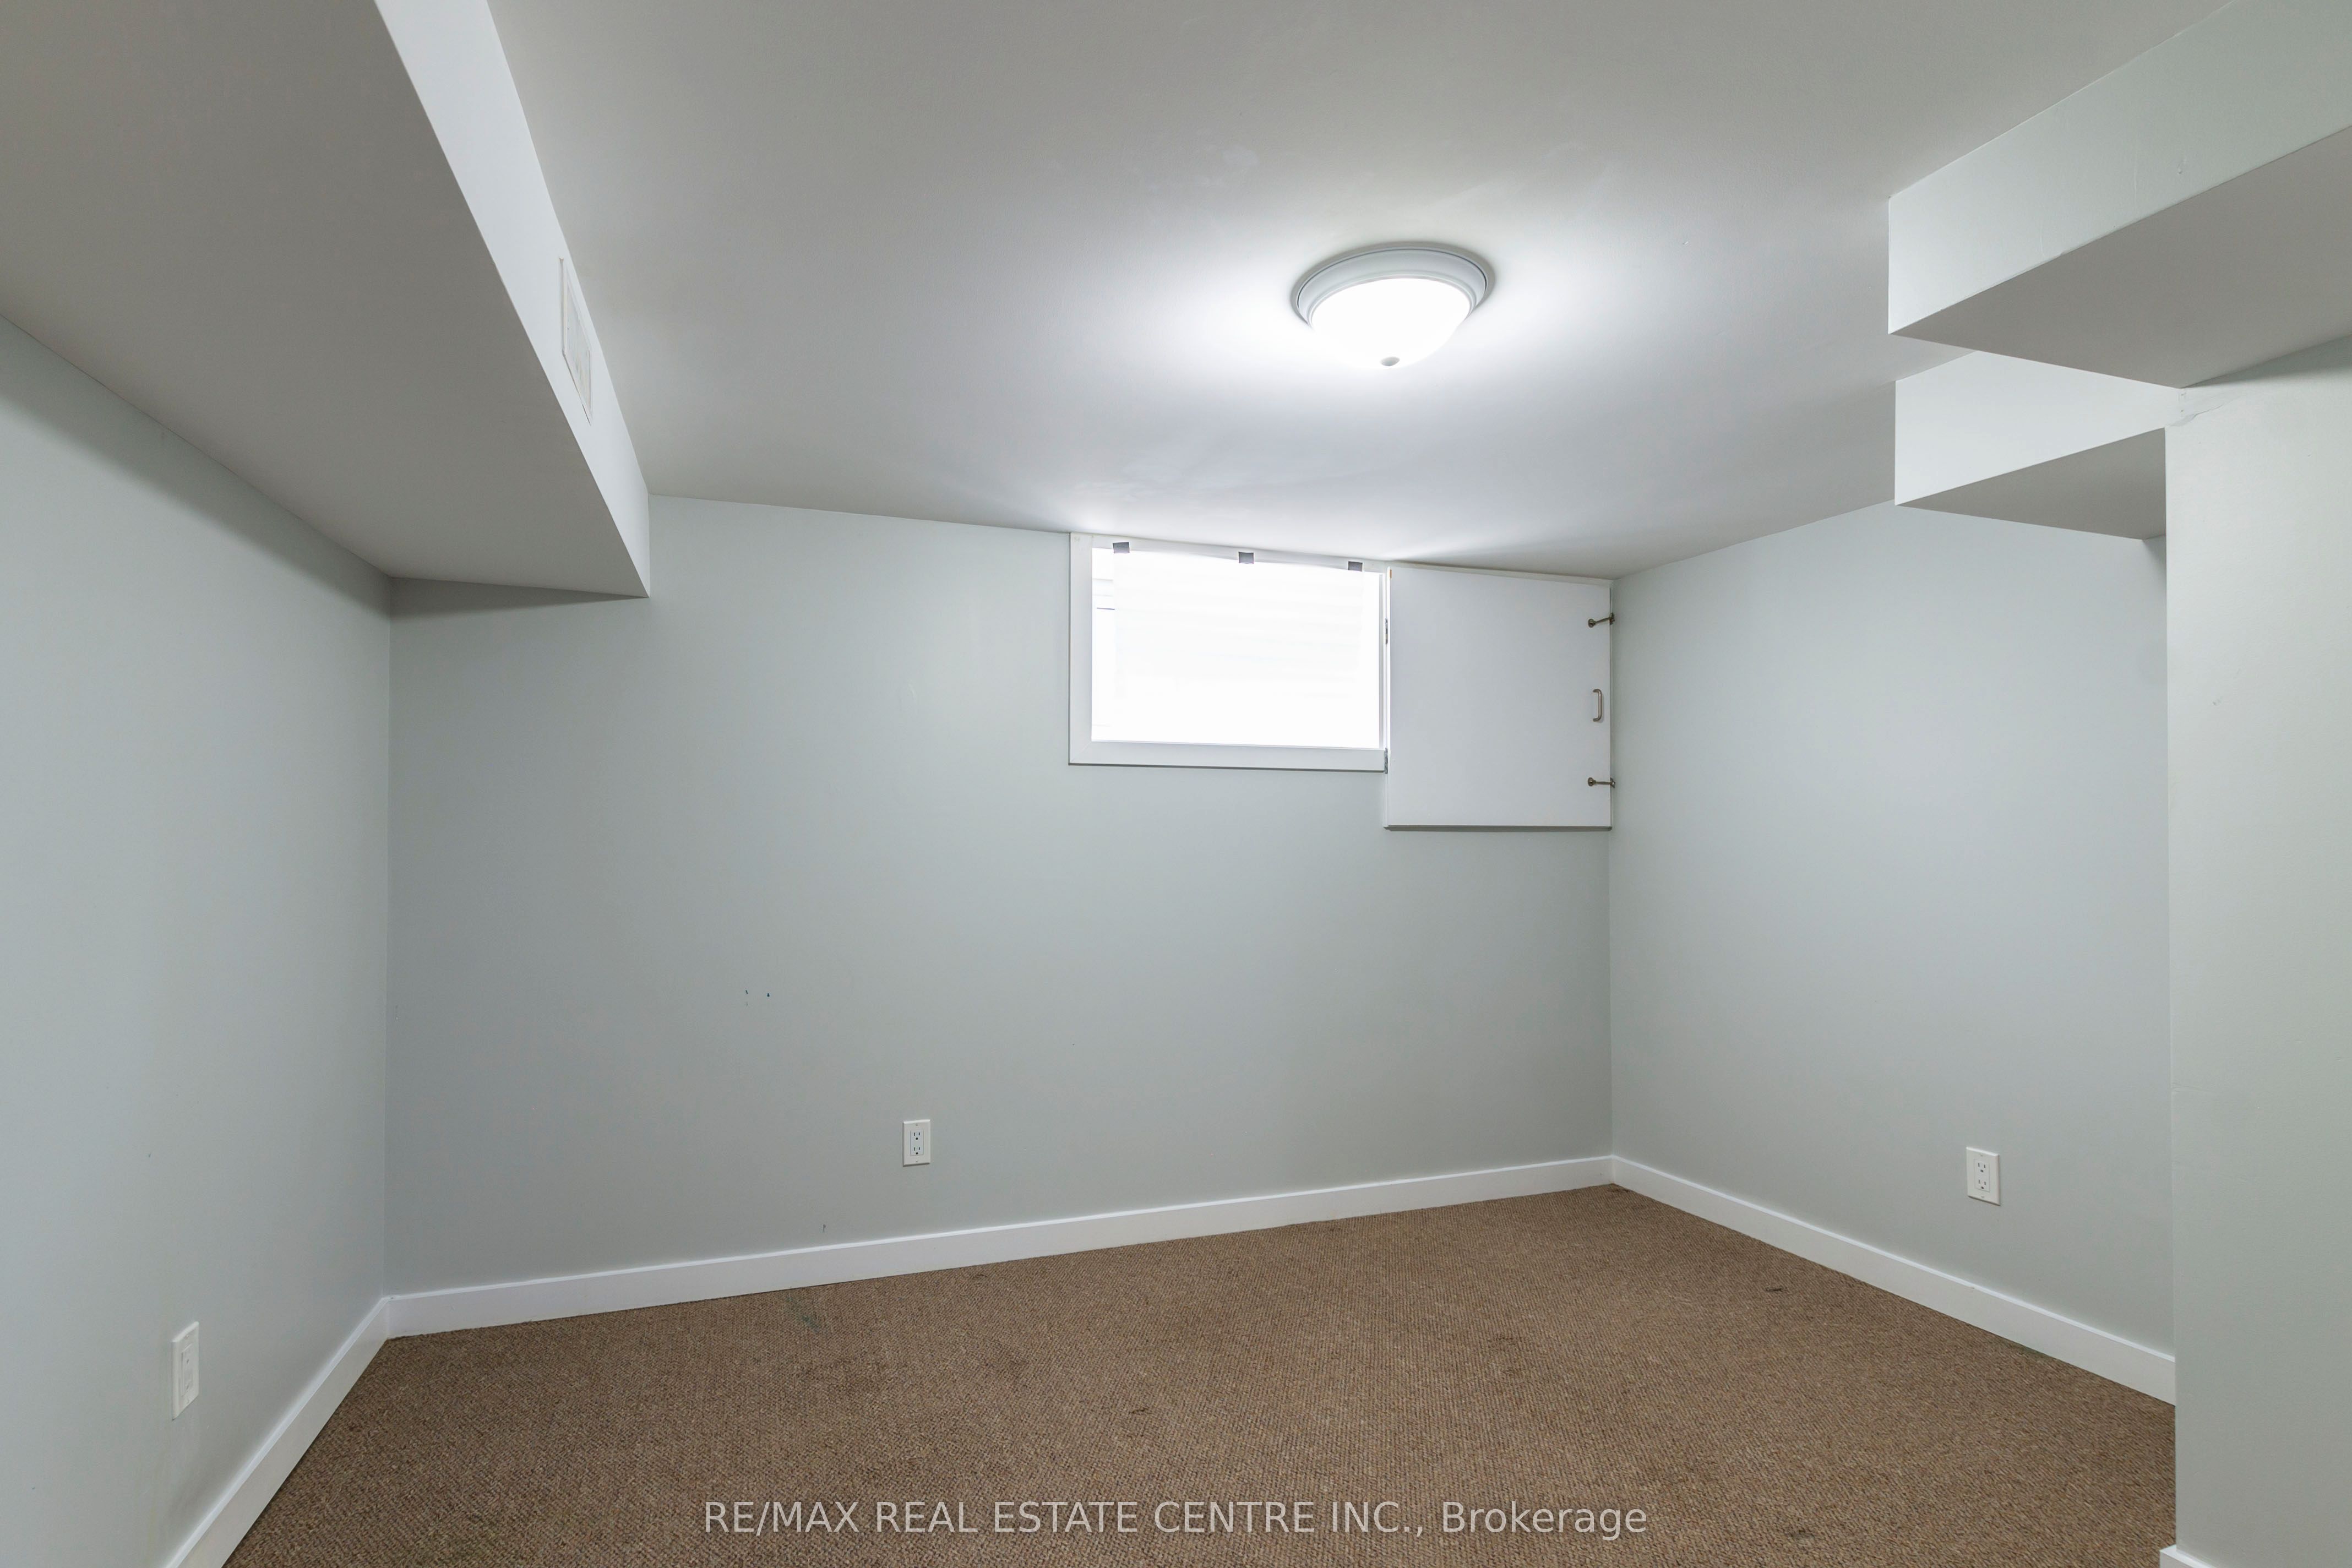
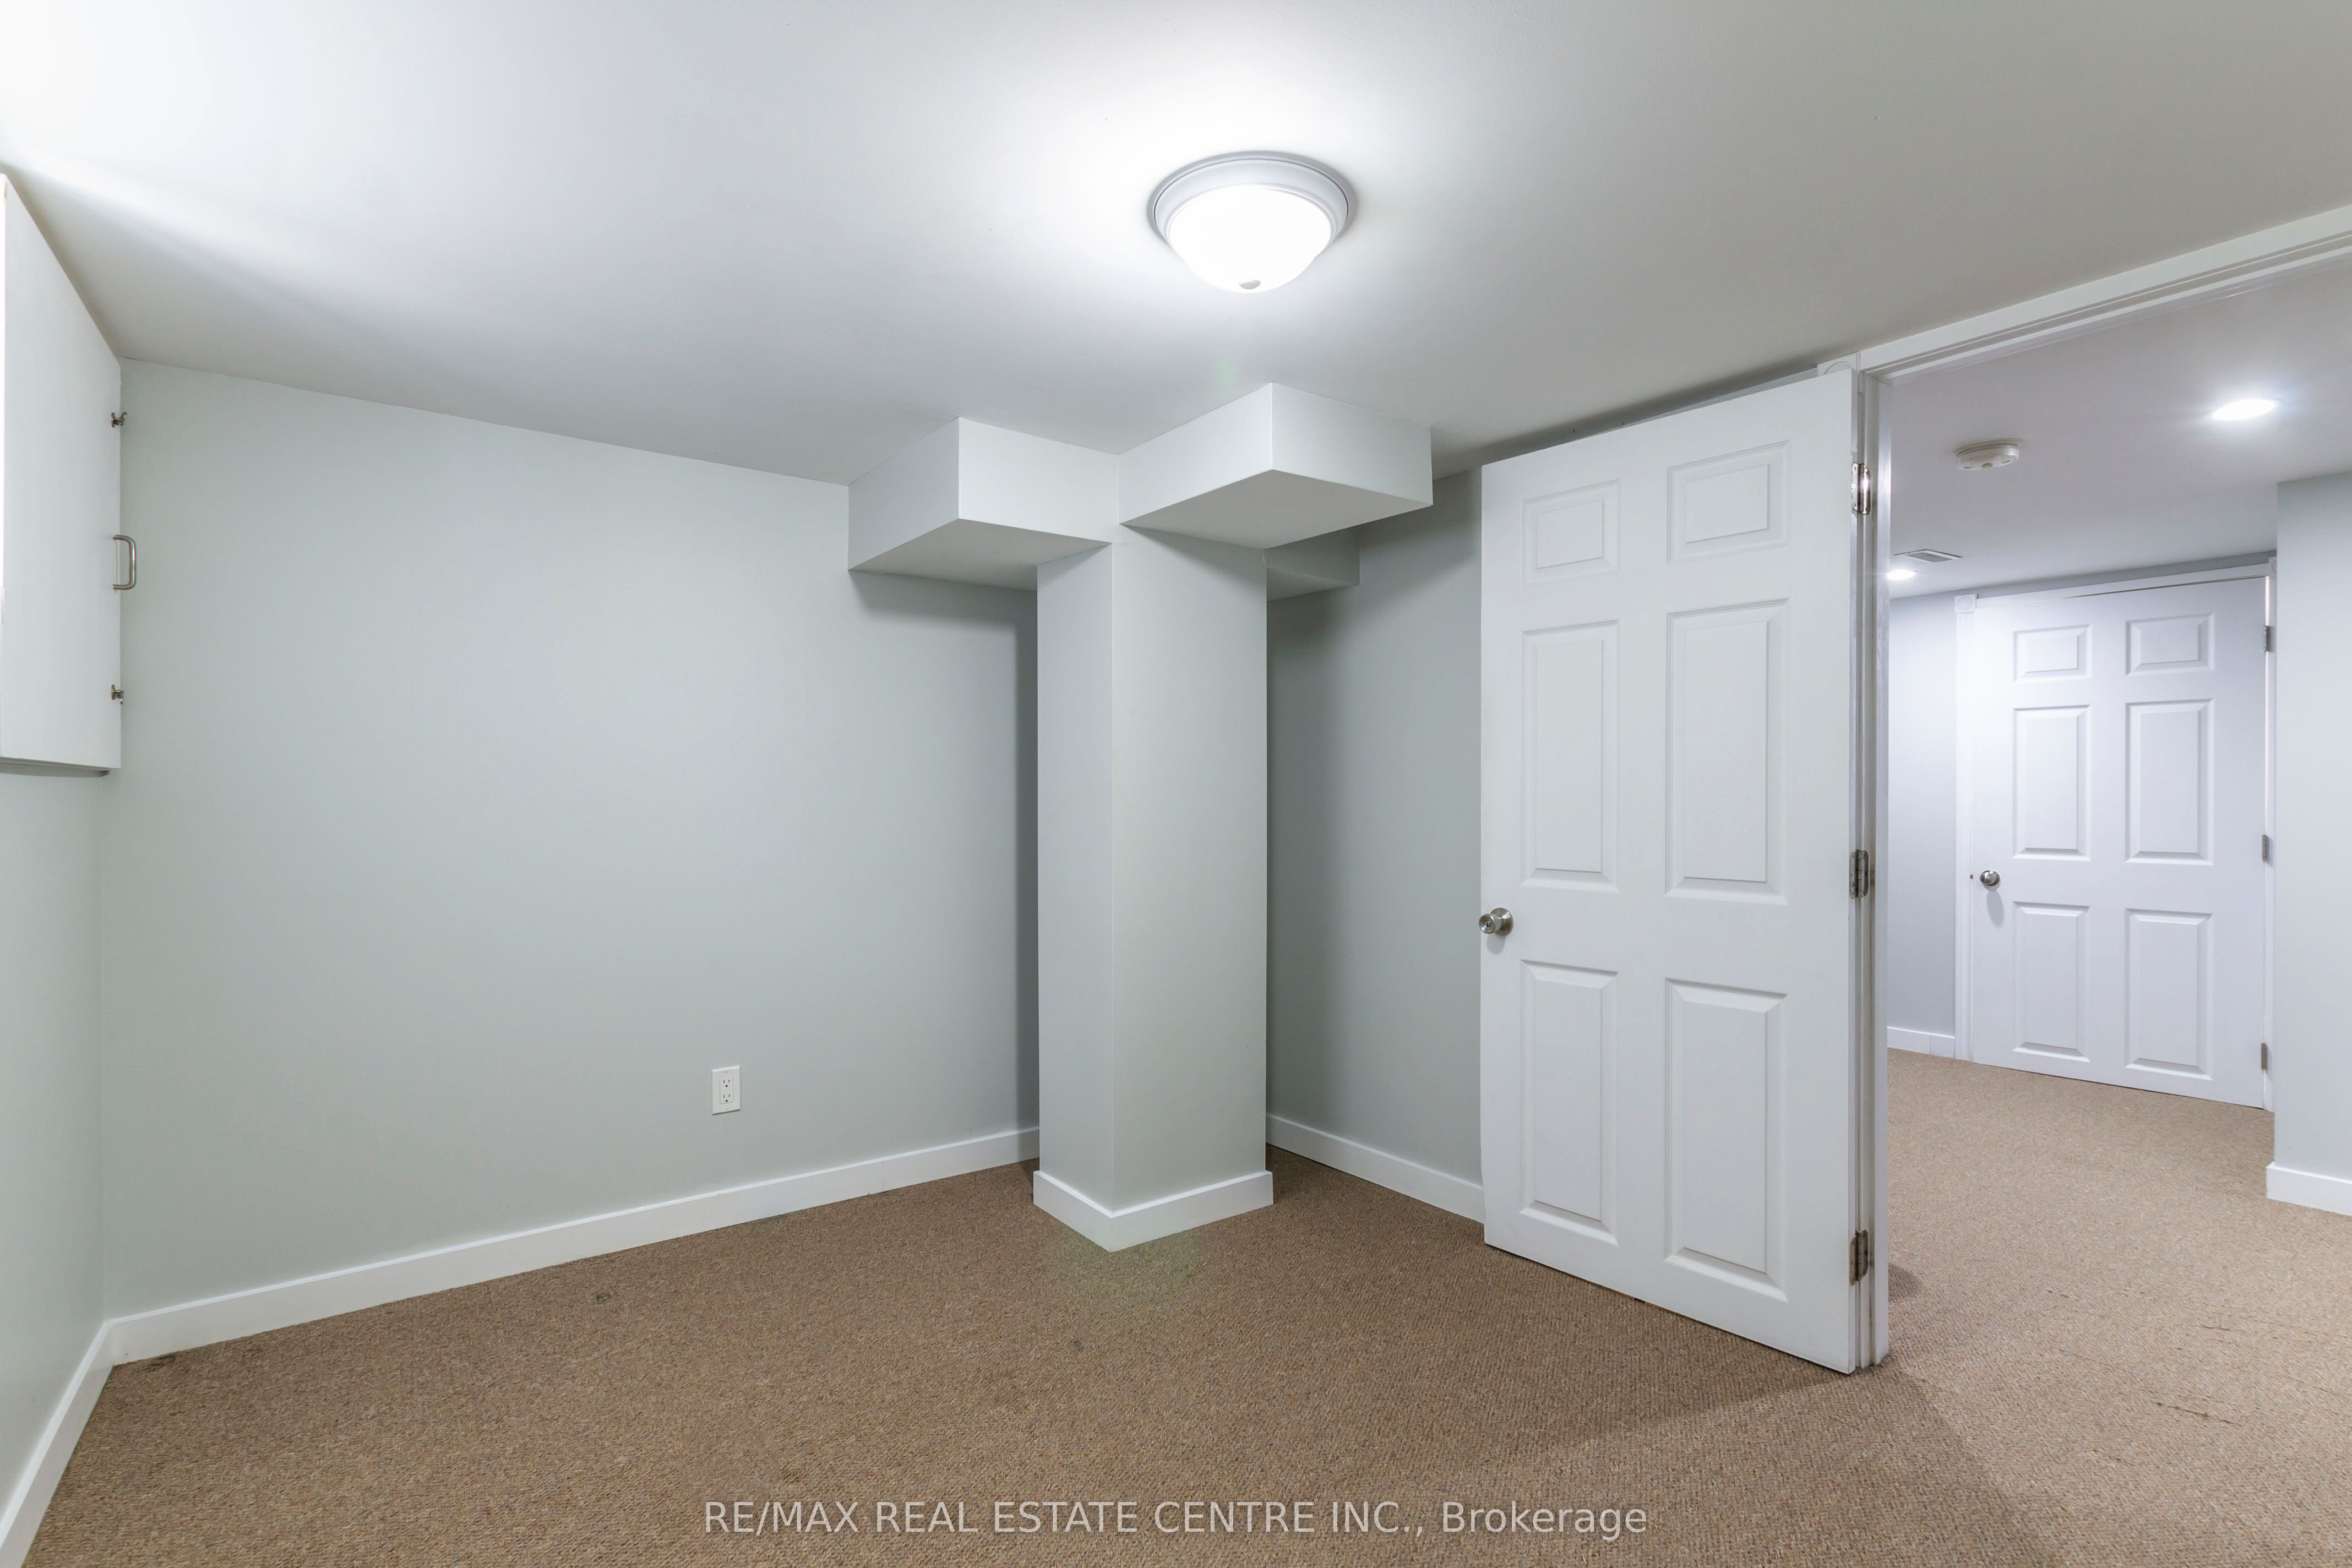
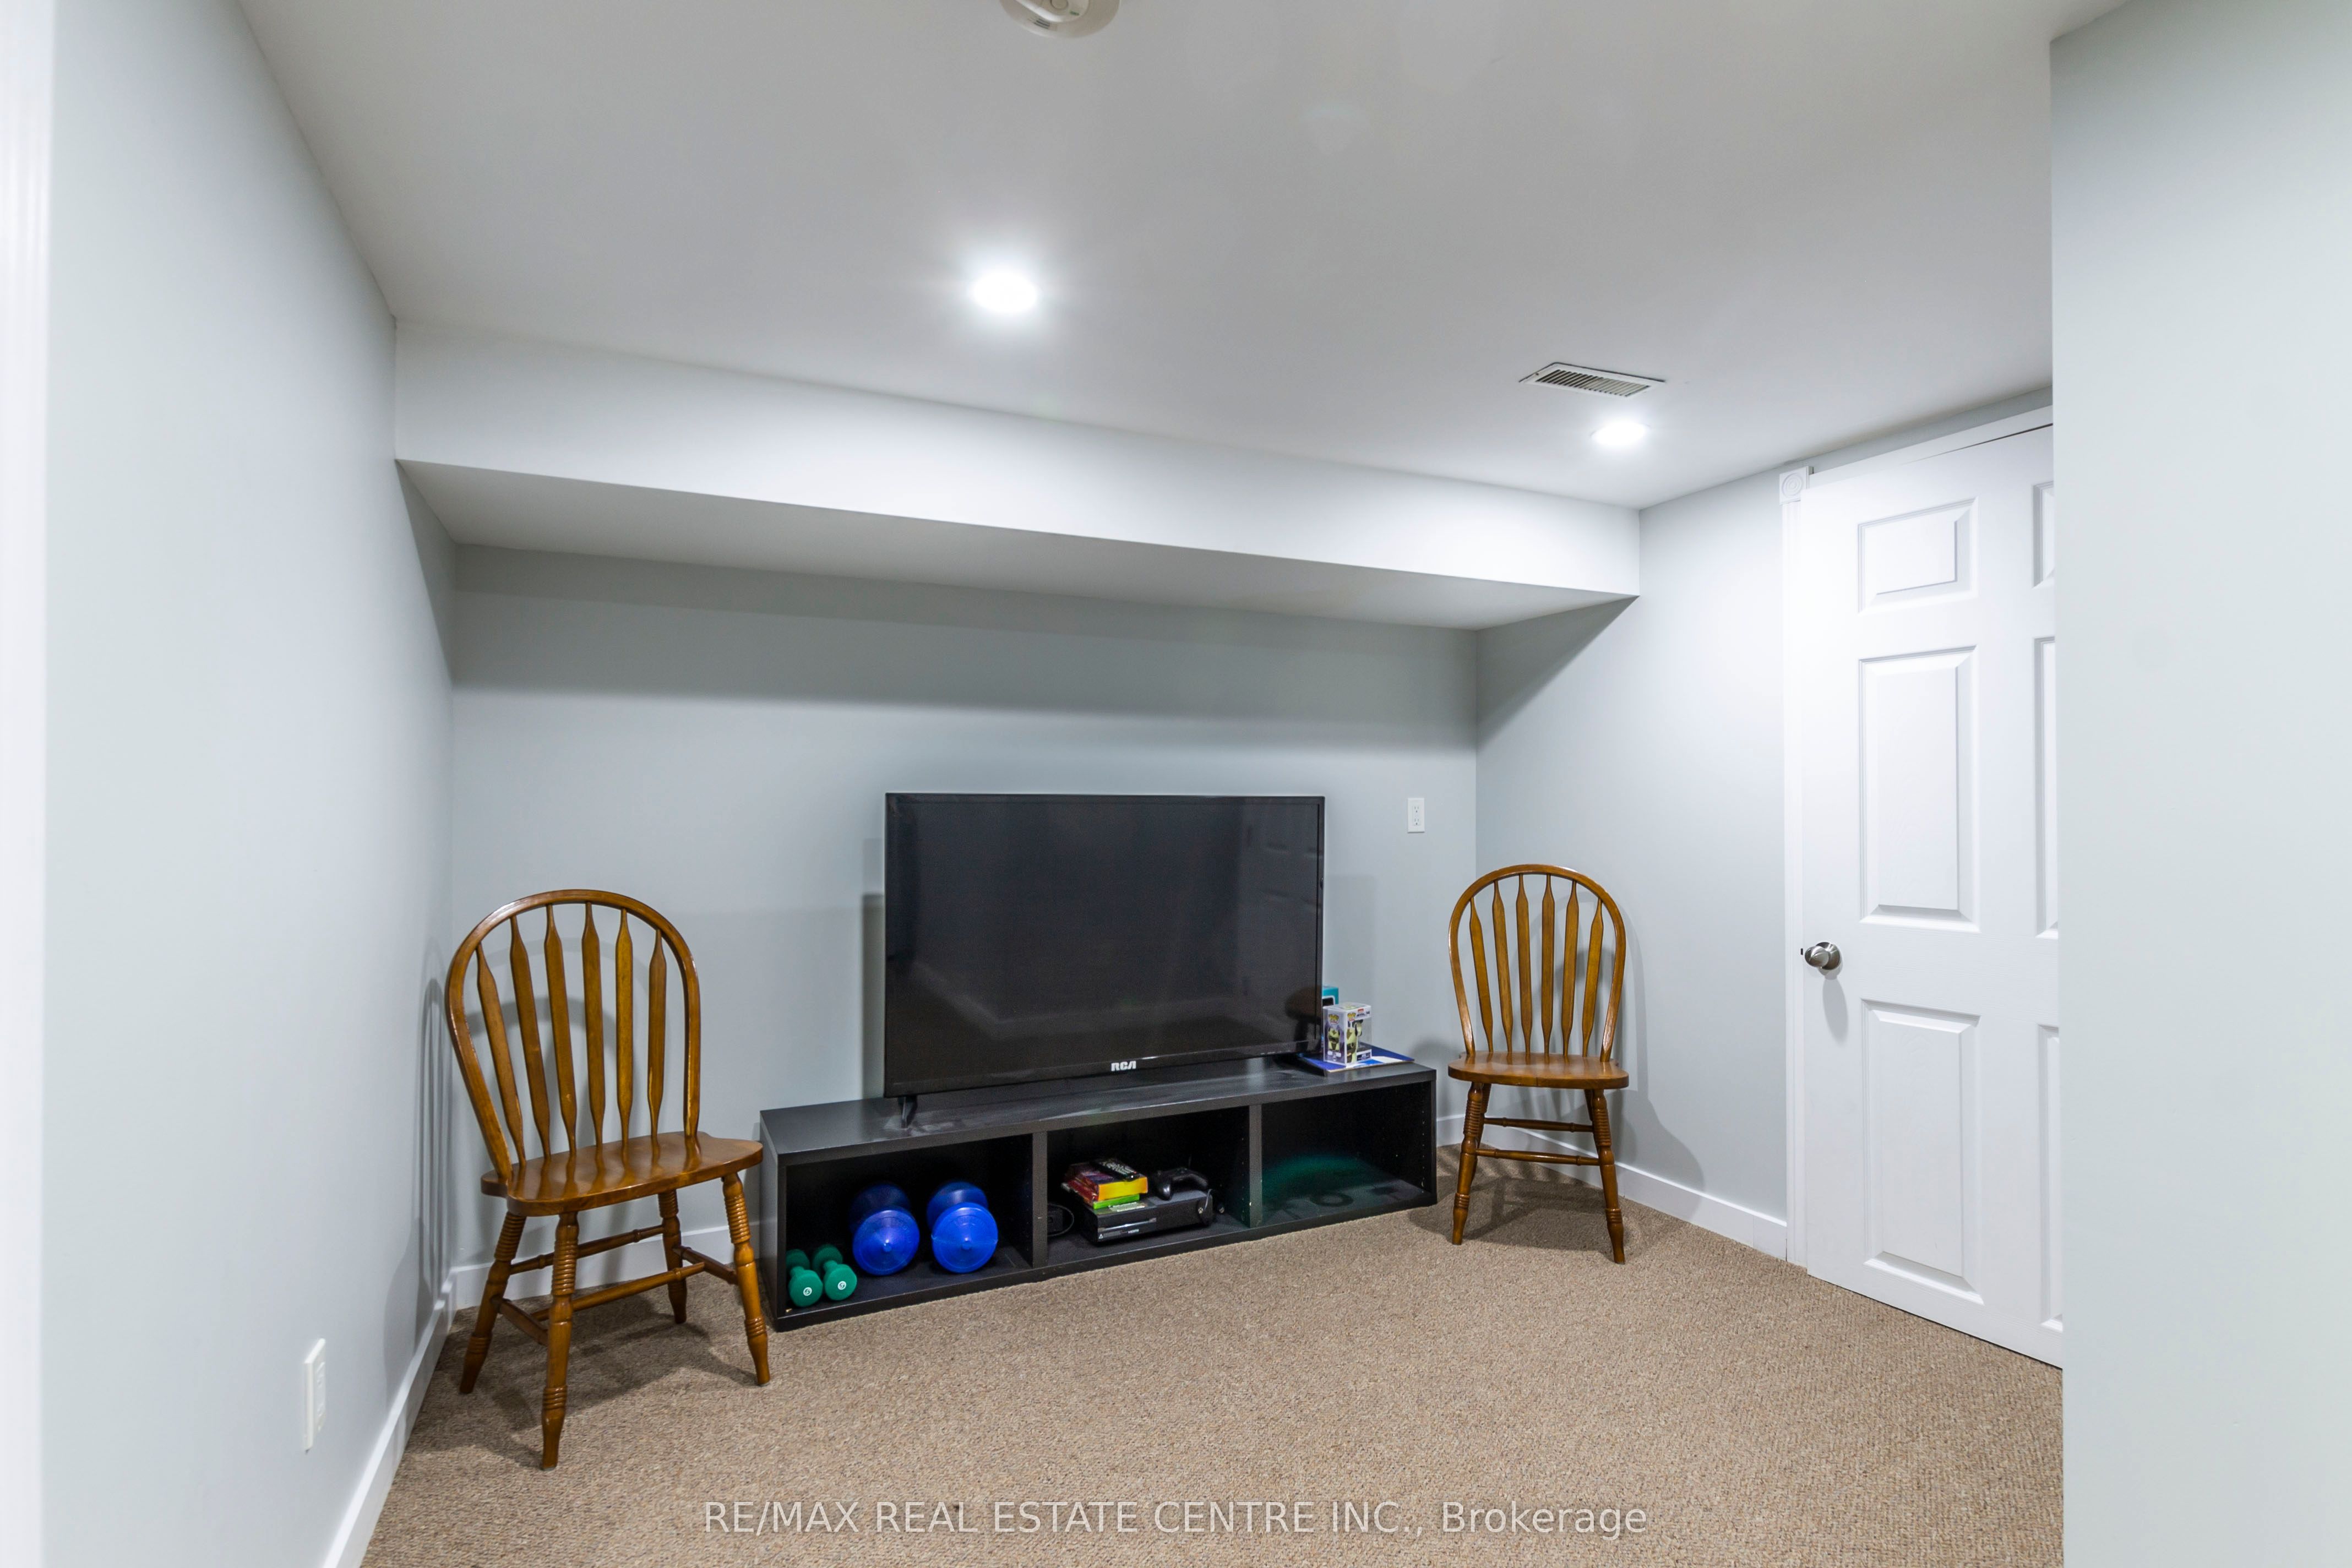
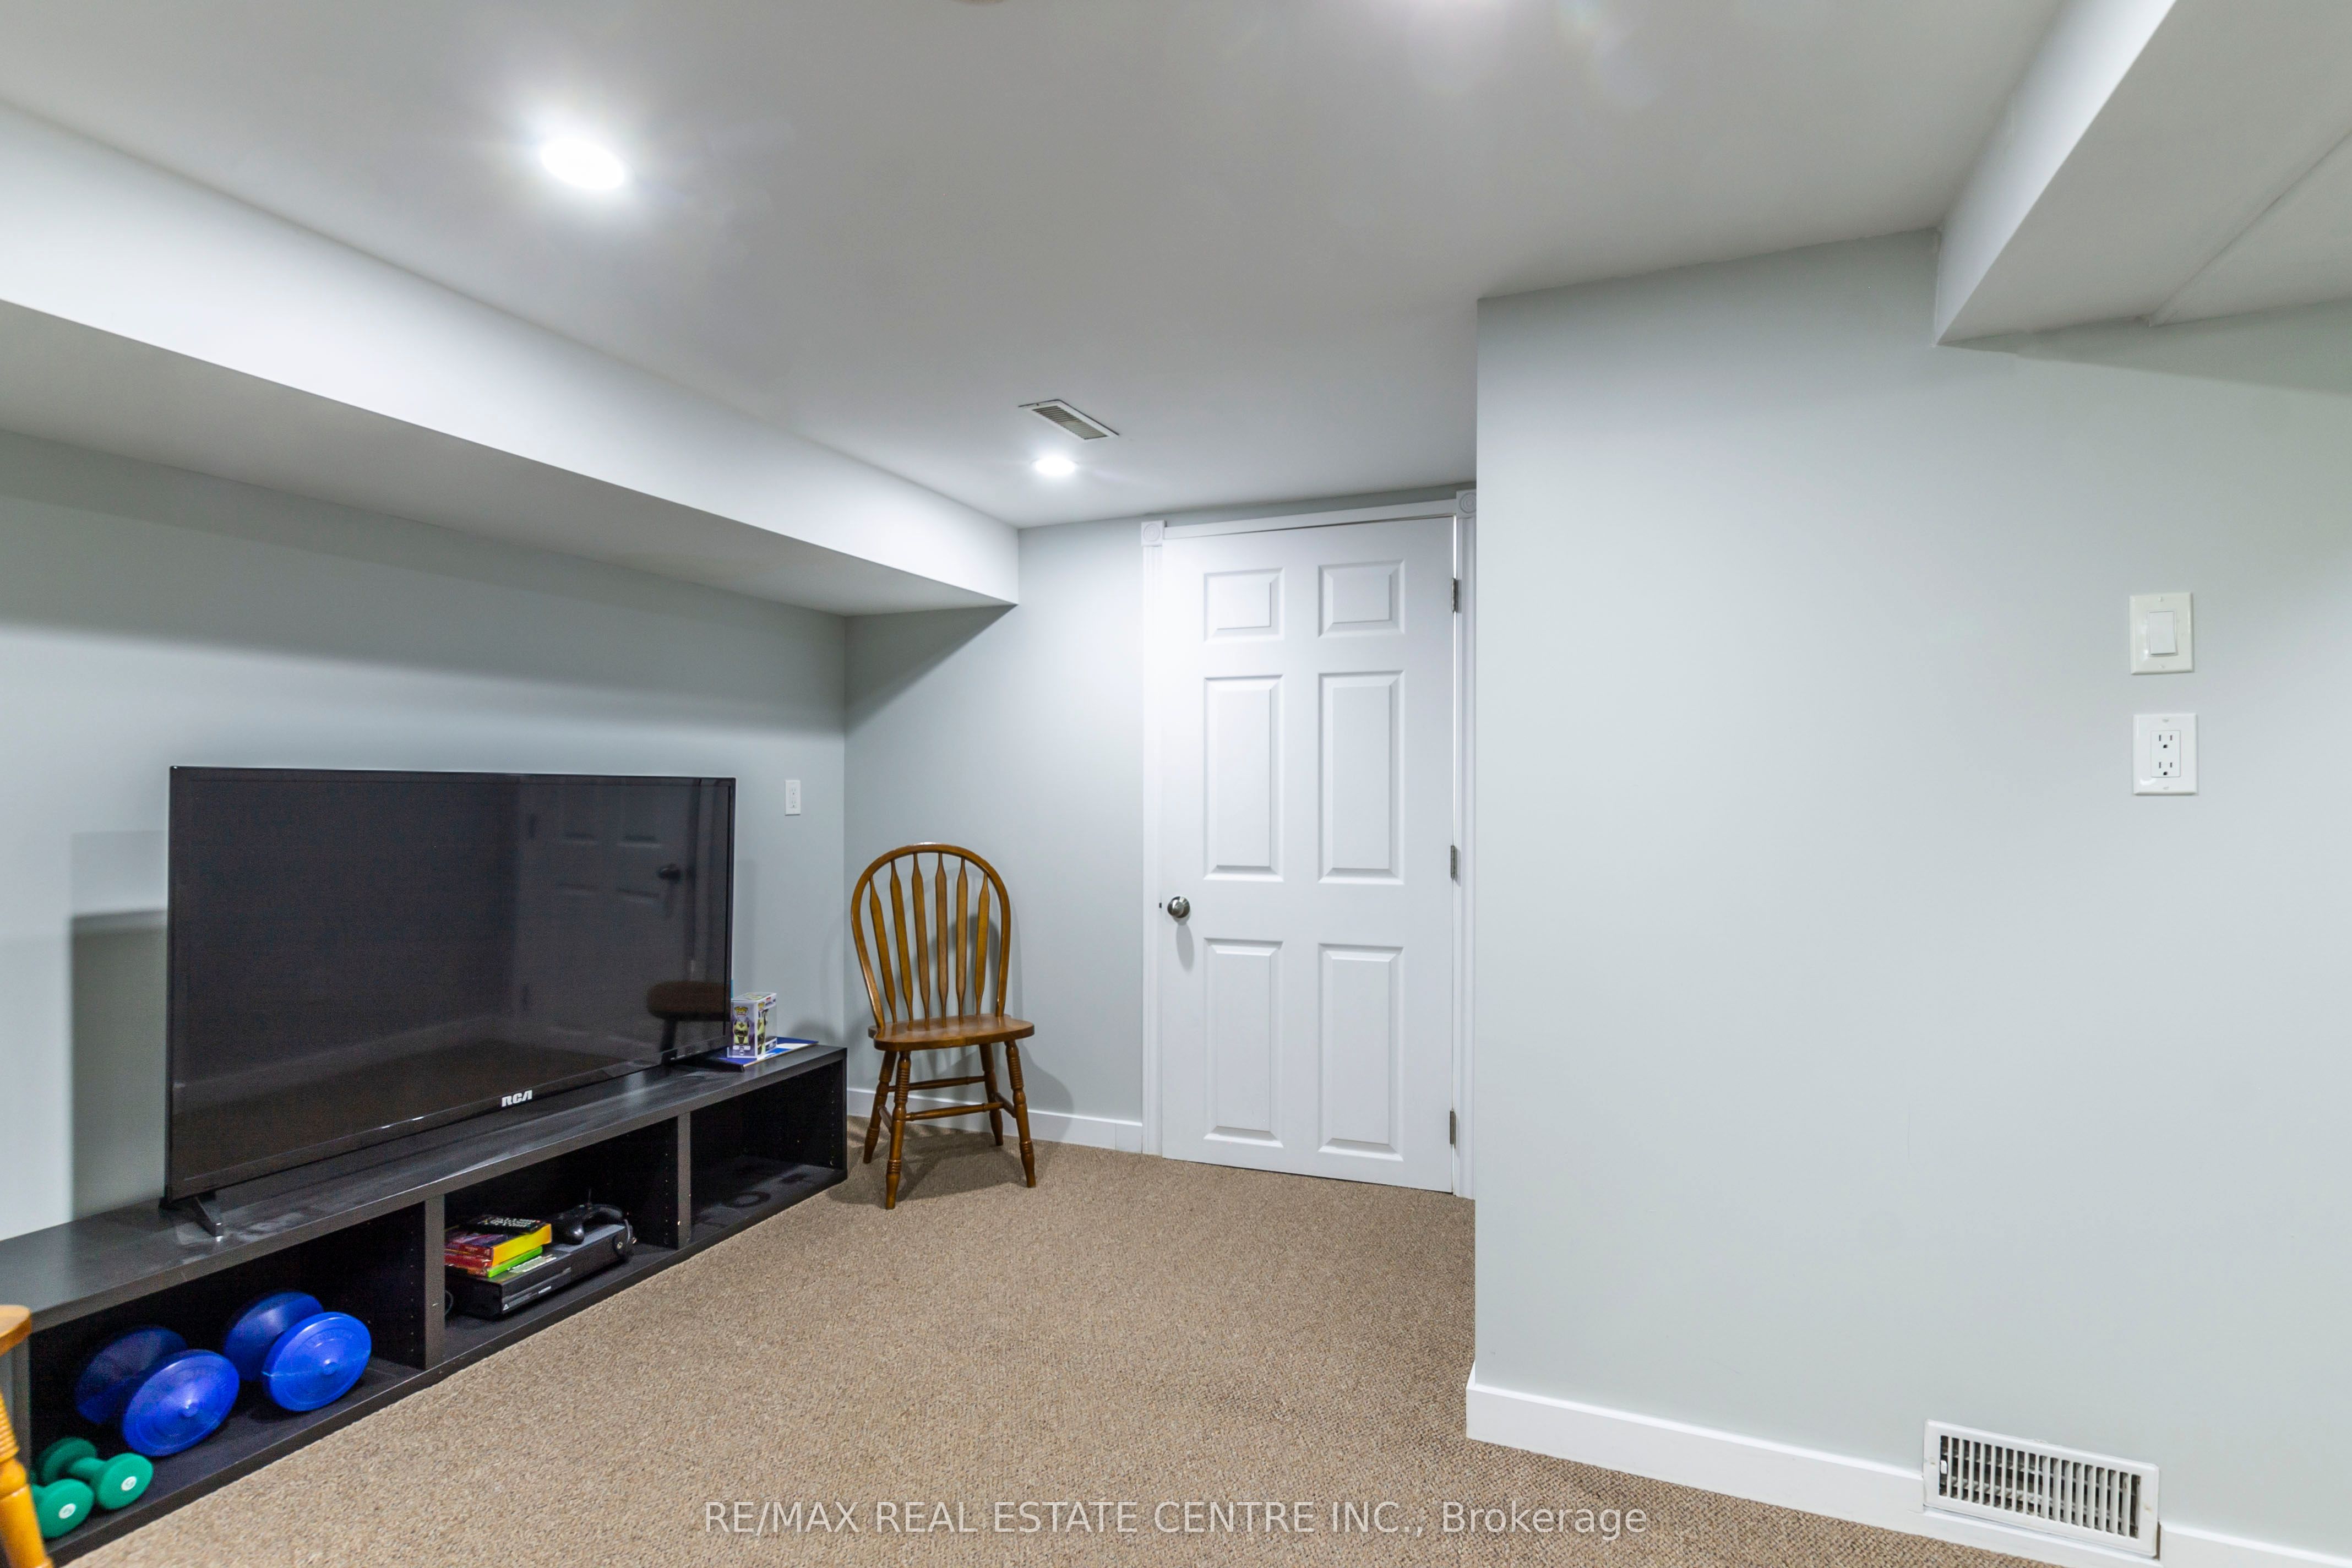
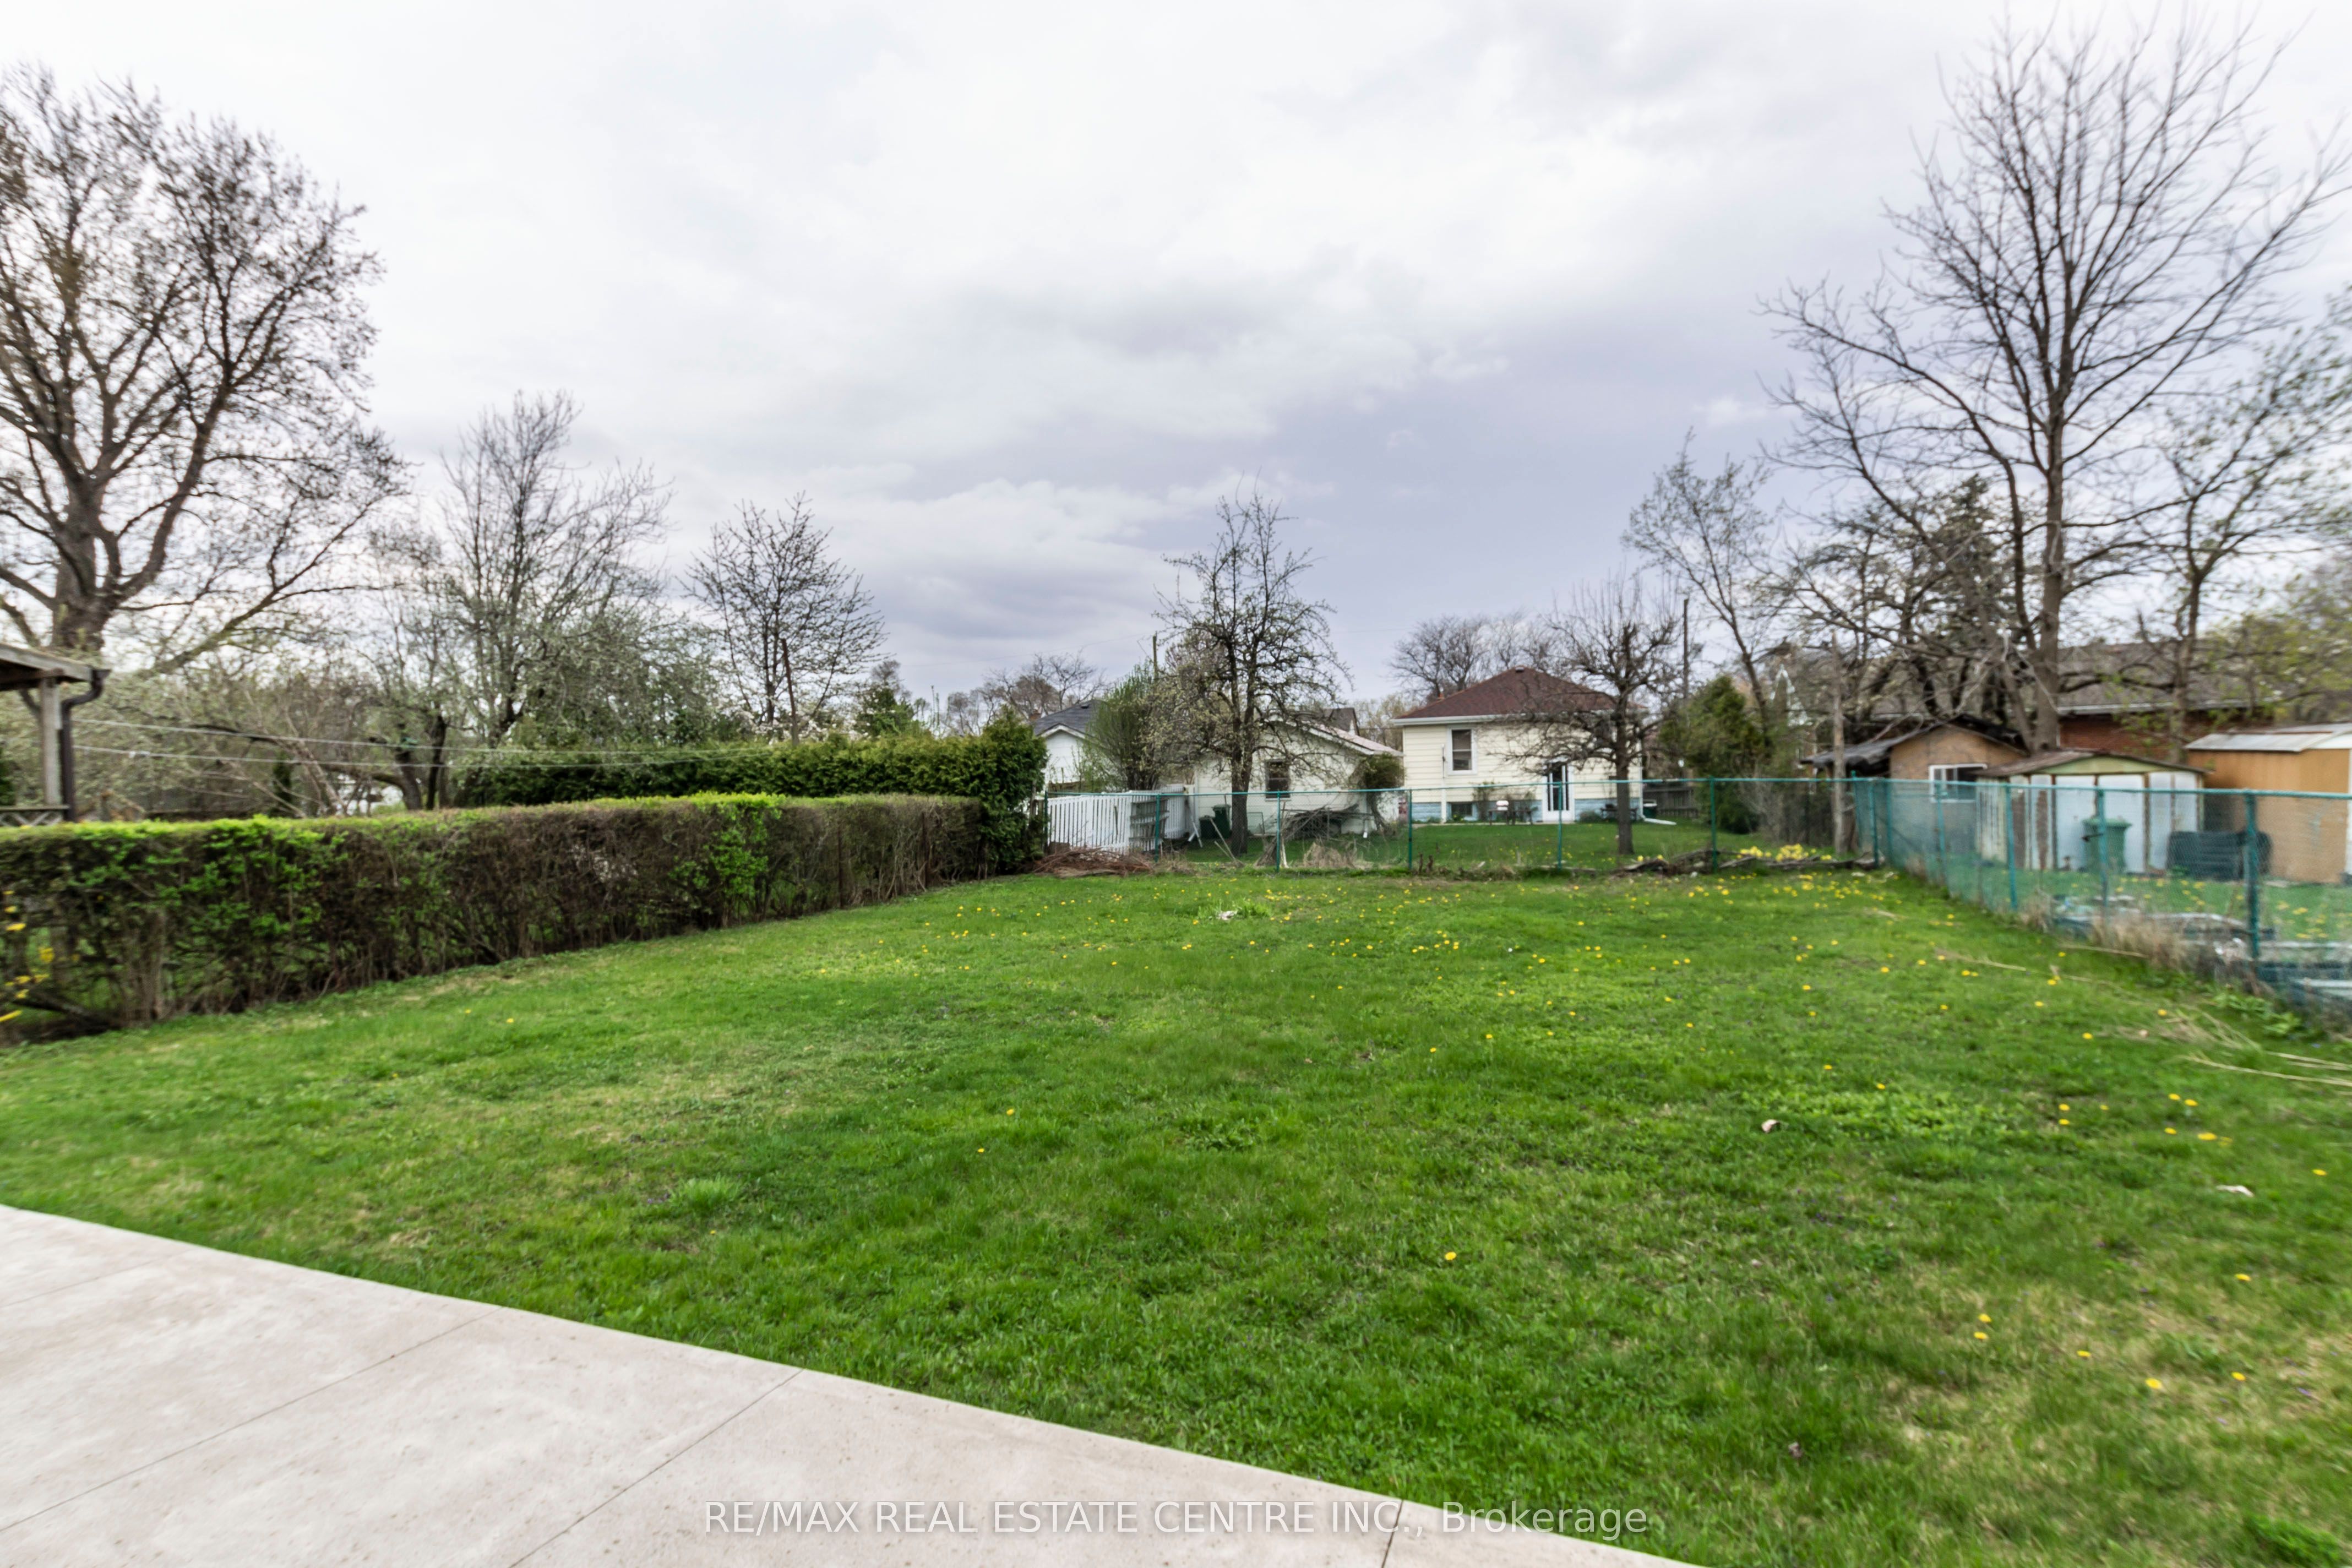
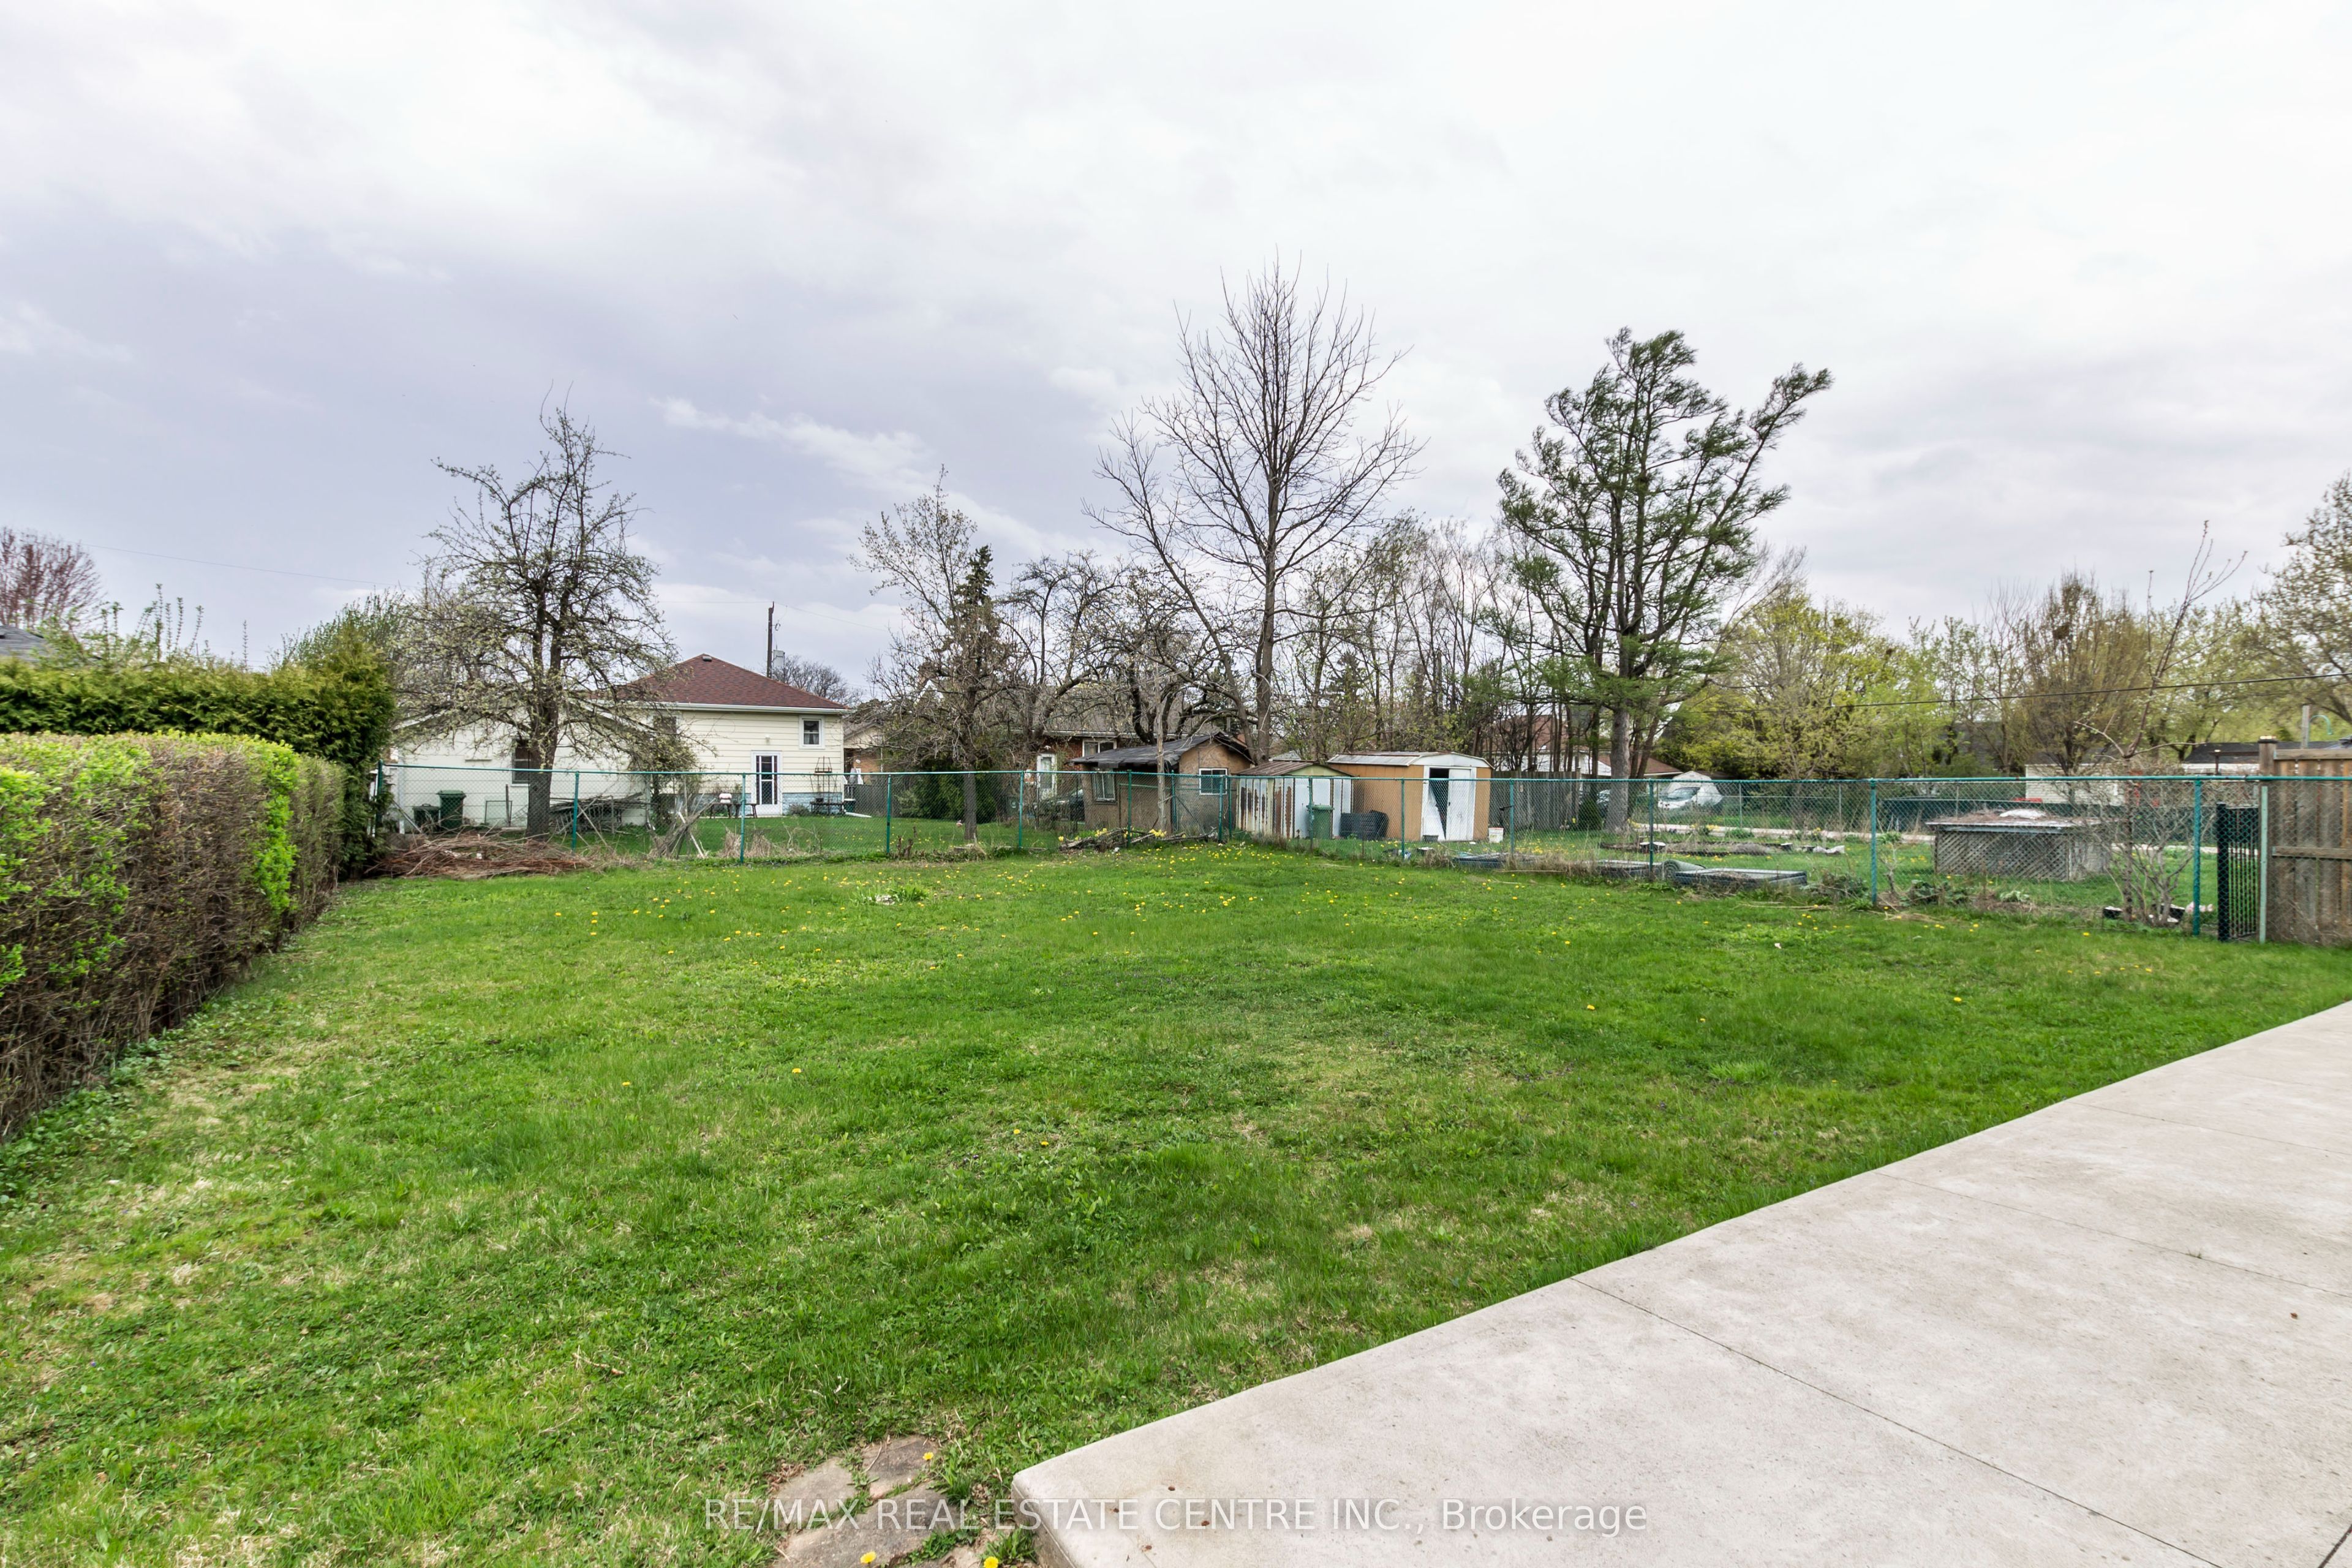
Location, Location, location. Centrally located in West Mountain, Walking distance to Walmart, Mcintyre Performing Arts Centre. Property has huge lot size, lots of parking available. Meticulously maintained, owner occupied property. Close to schools. Income potential, 3+2 bedrooms, 2 bathrooms, separate entrance.
Location, Location, location. Centrally located in West Mountain, Walking distance to Walmart, Mcintyre Performing Arts Centre. Property has huge lot size, lots of parking available. Meticulously maintained, owner occupied property. Close to schools. Income potential, 3+2 bedrooms, 2 bathrooms, separate entrance.
See MoreKey Info
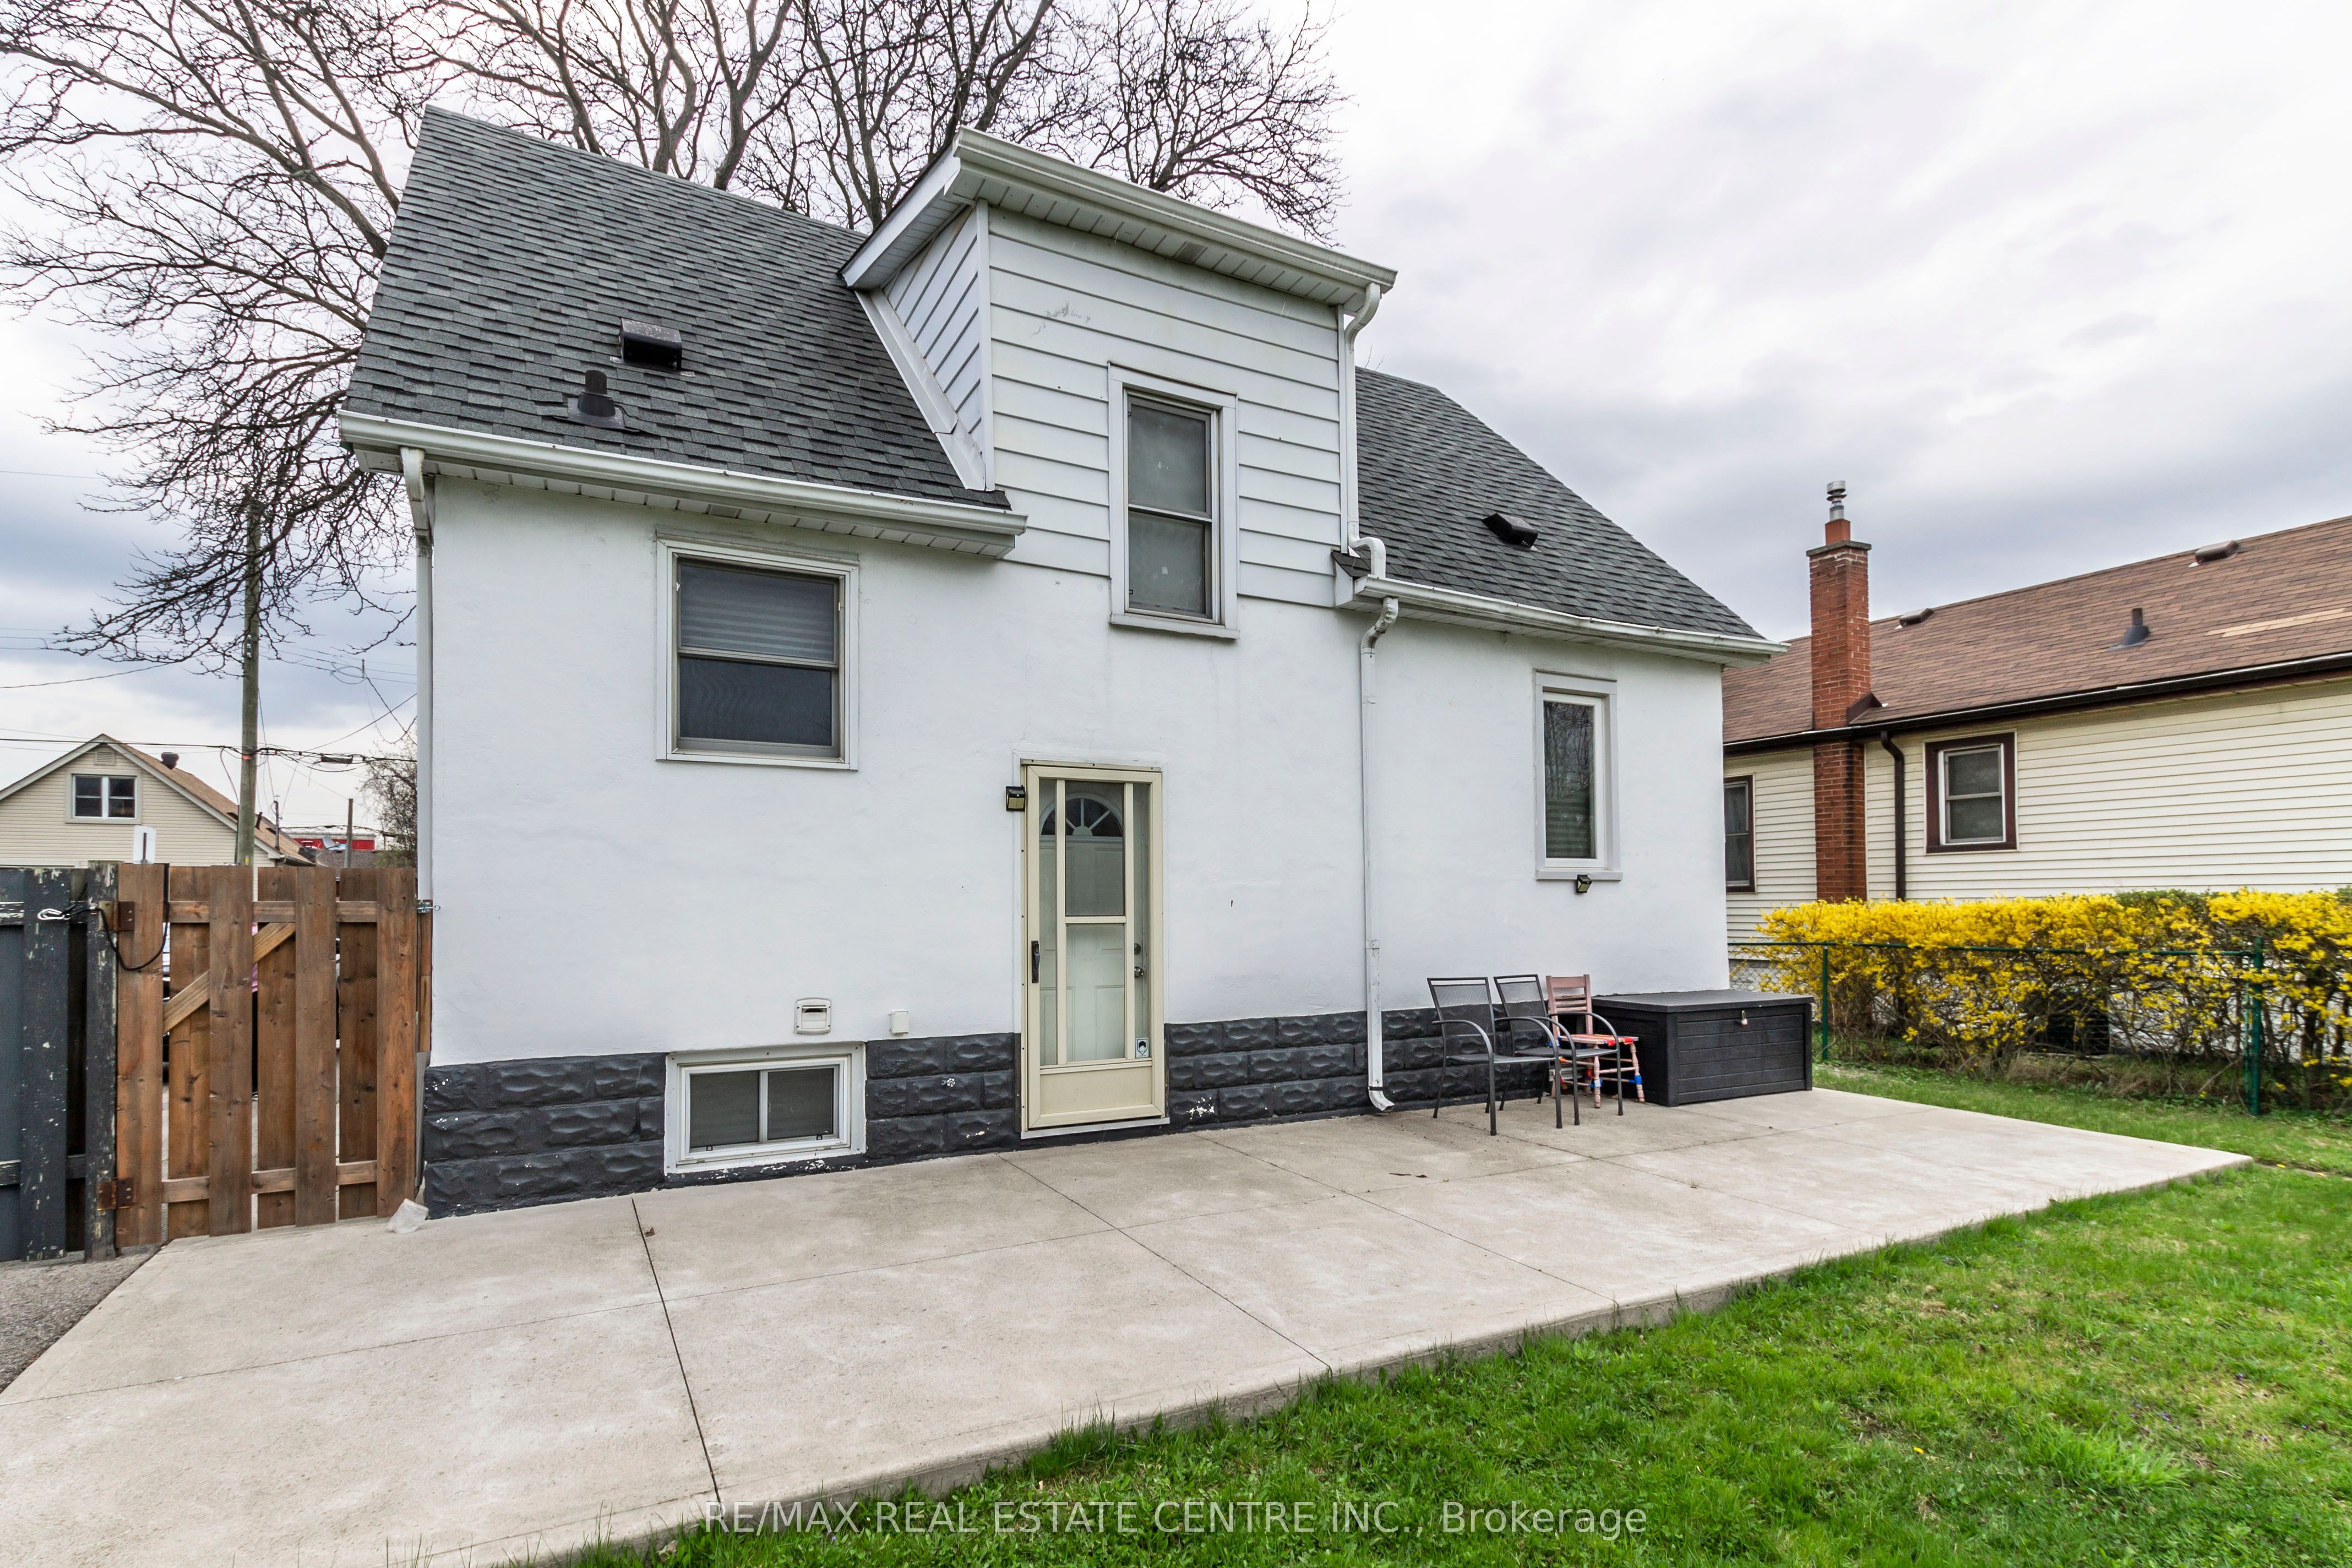
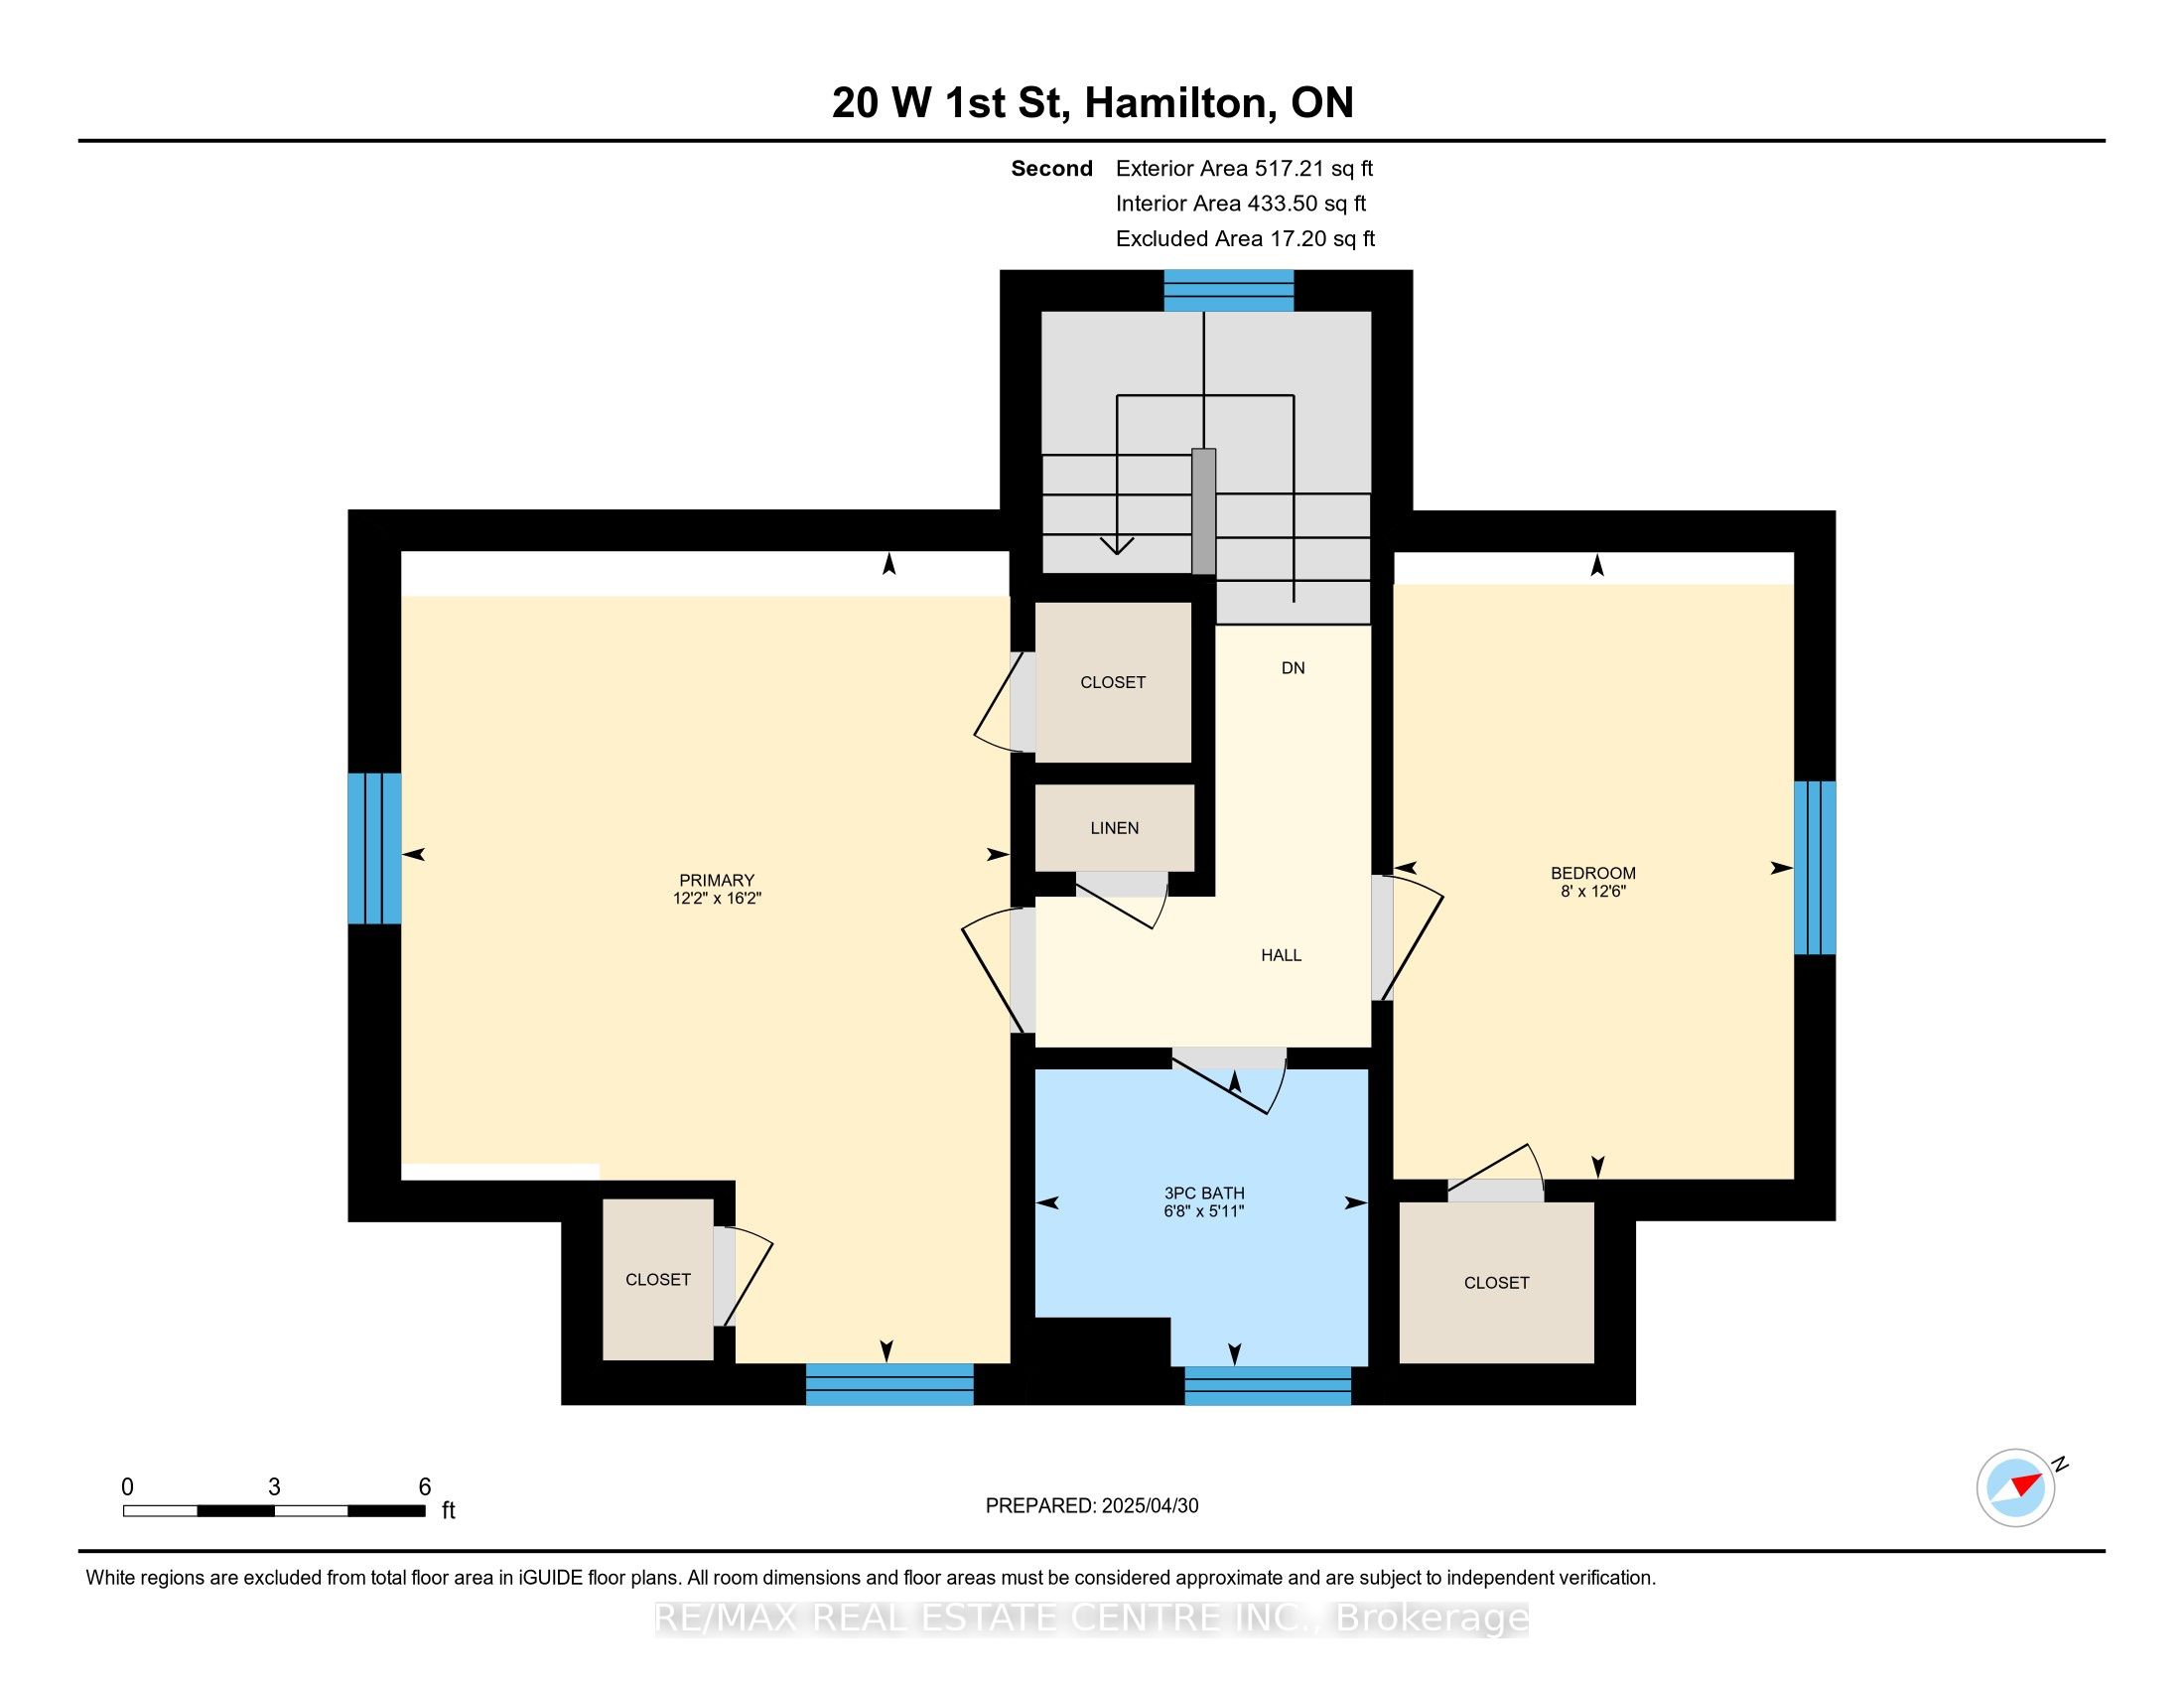
- 1.5-Storey Detached
- 3-Car Driveway
- No Garage
- Upper James
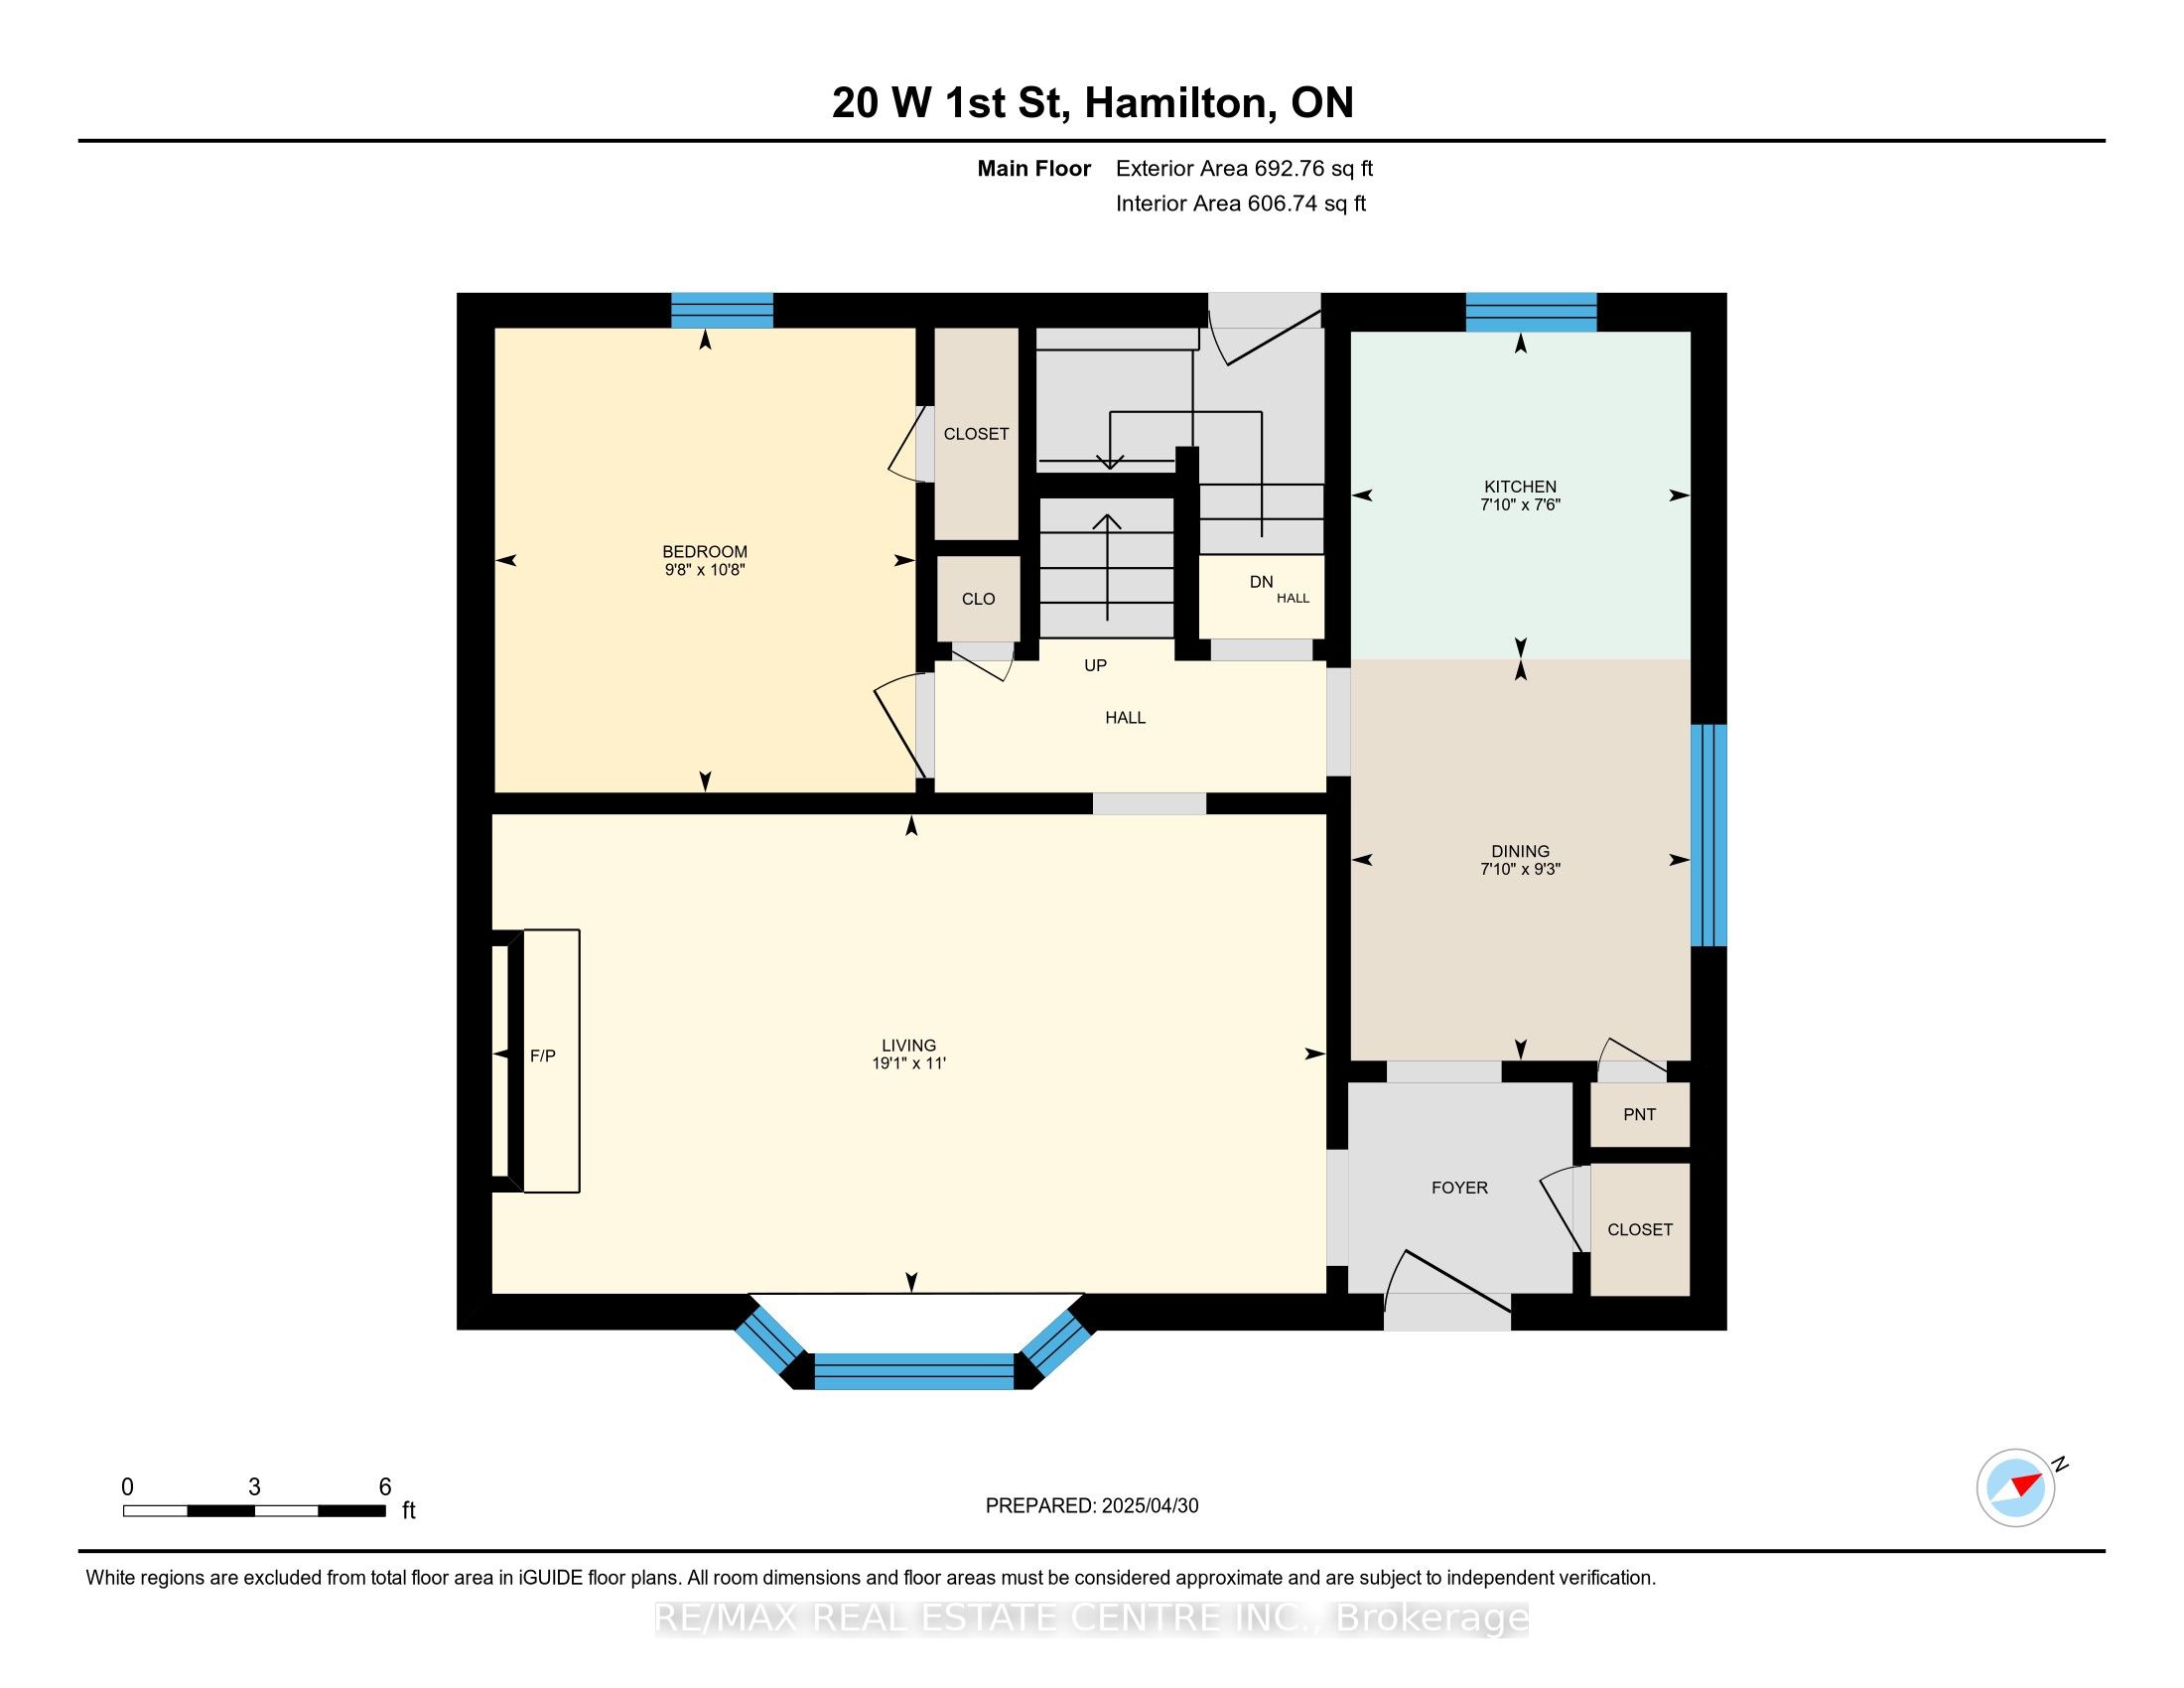
- 1100-1500 Approximate Sq Feet
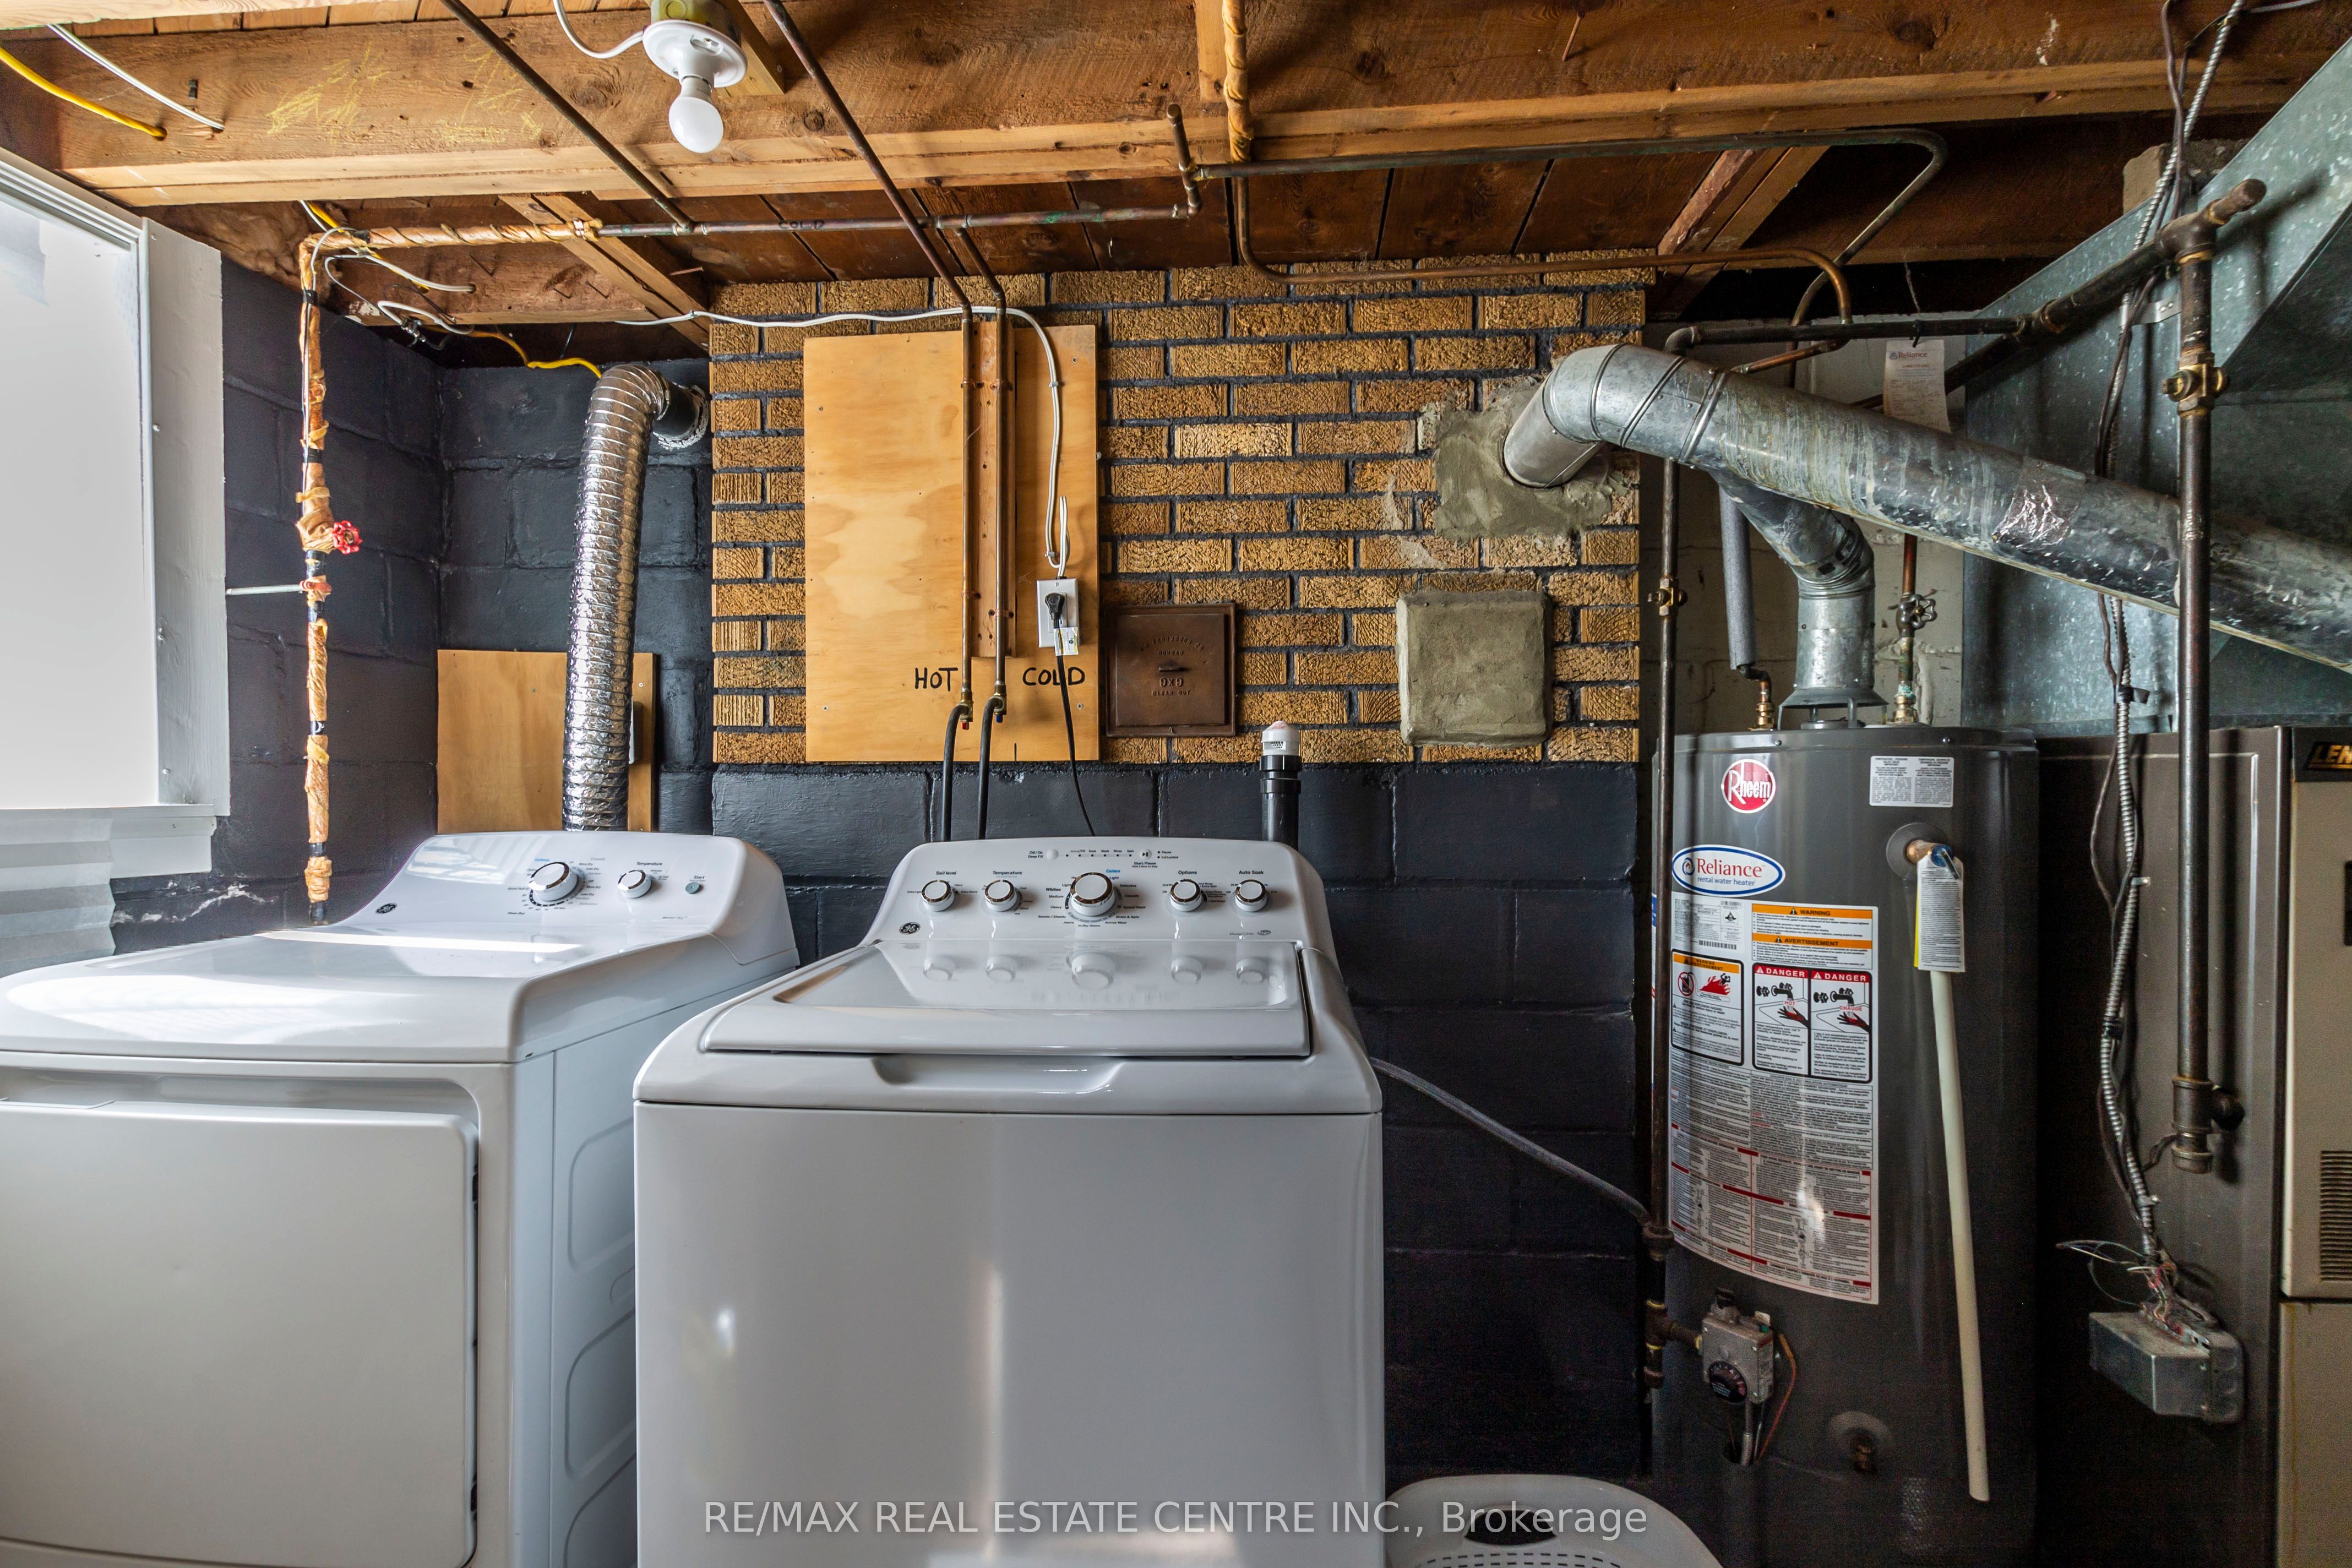
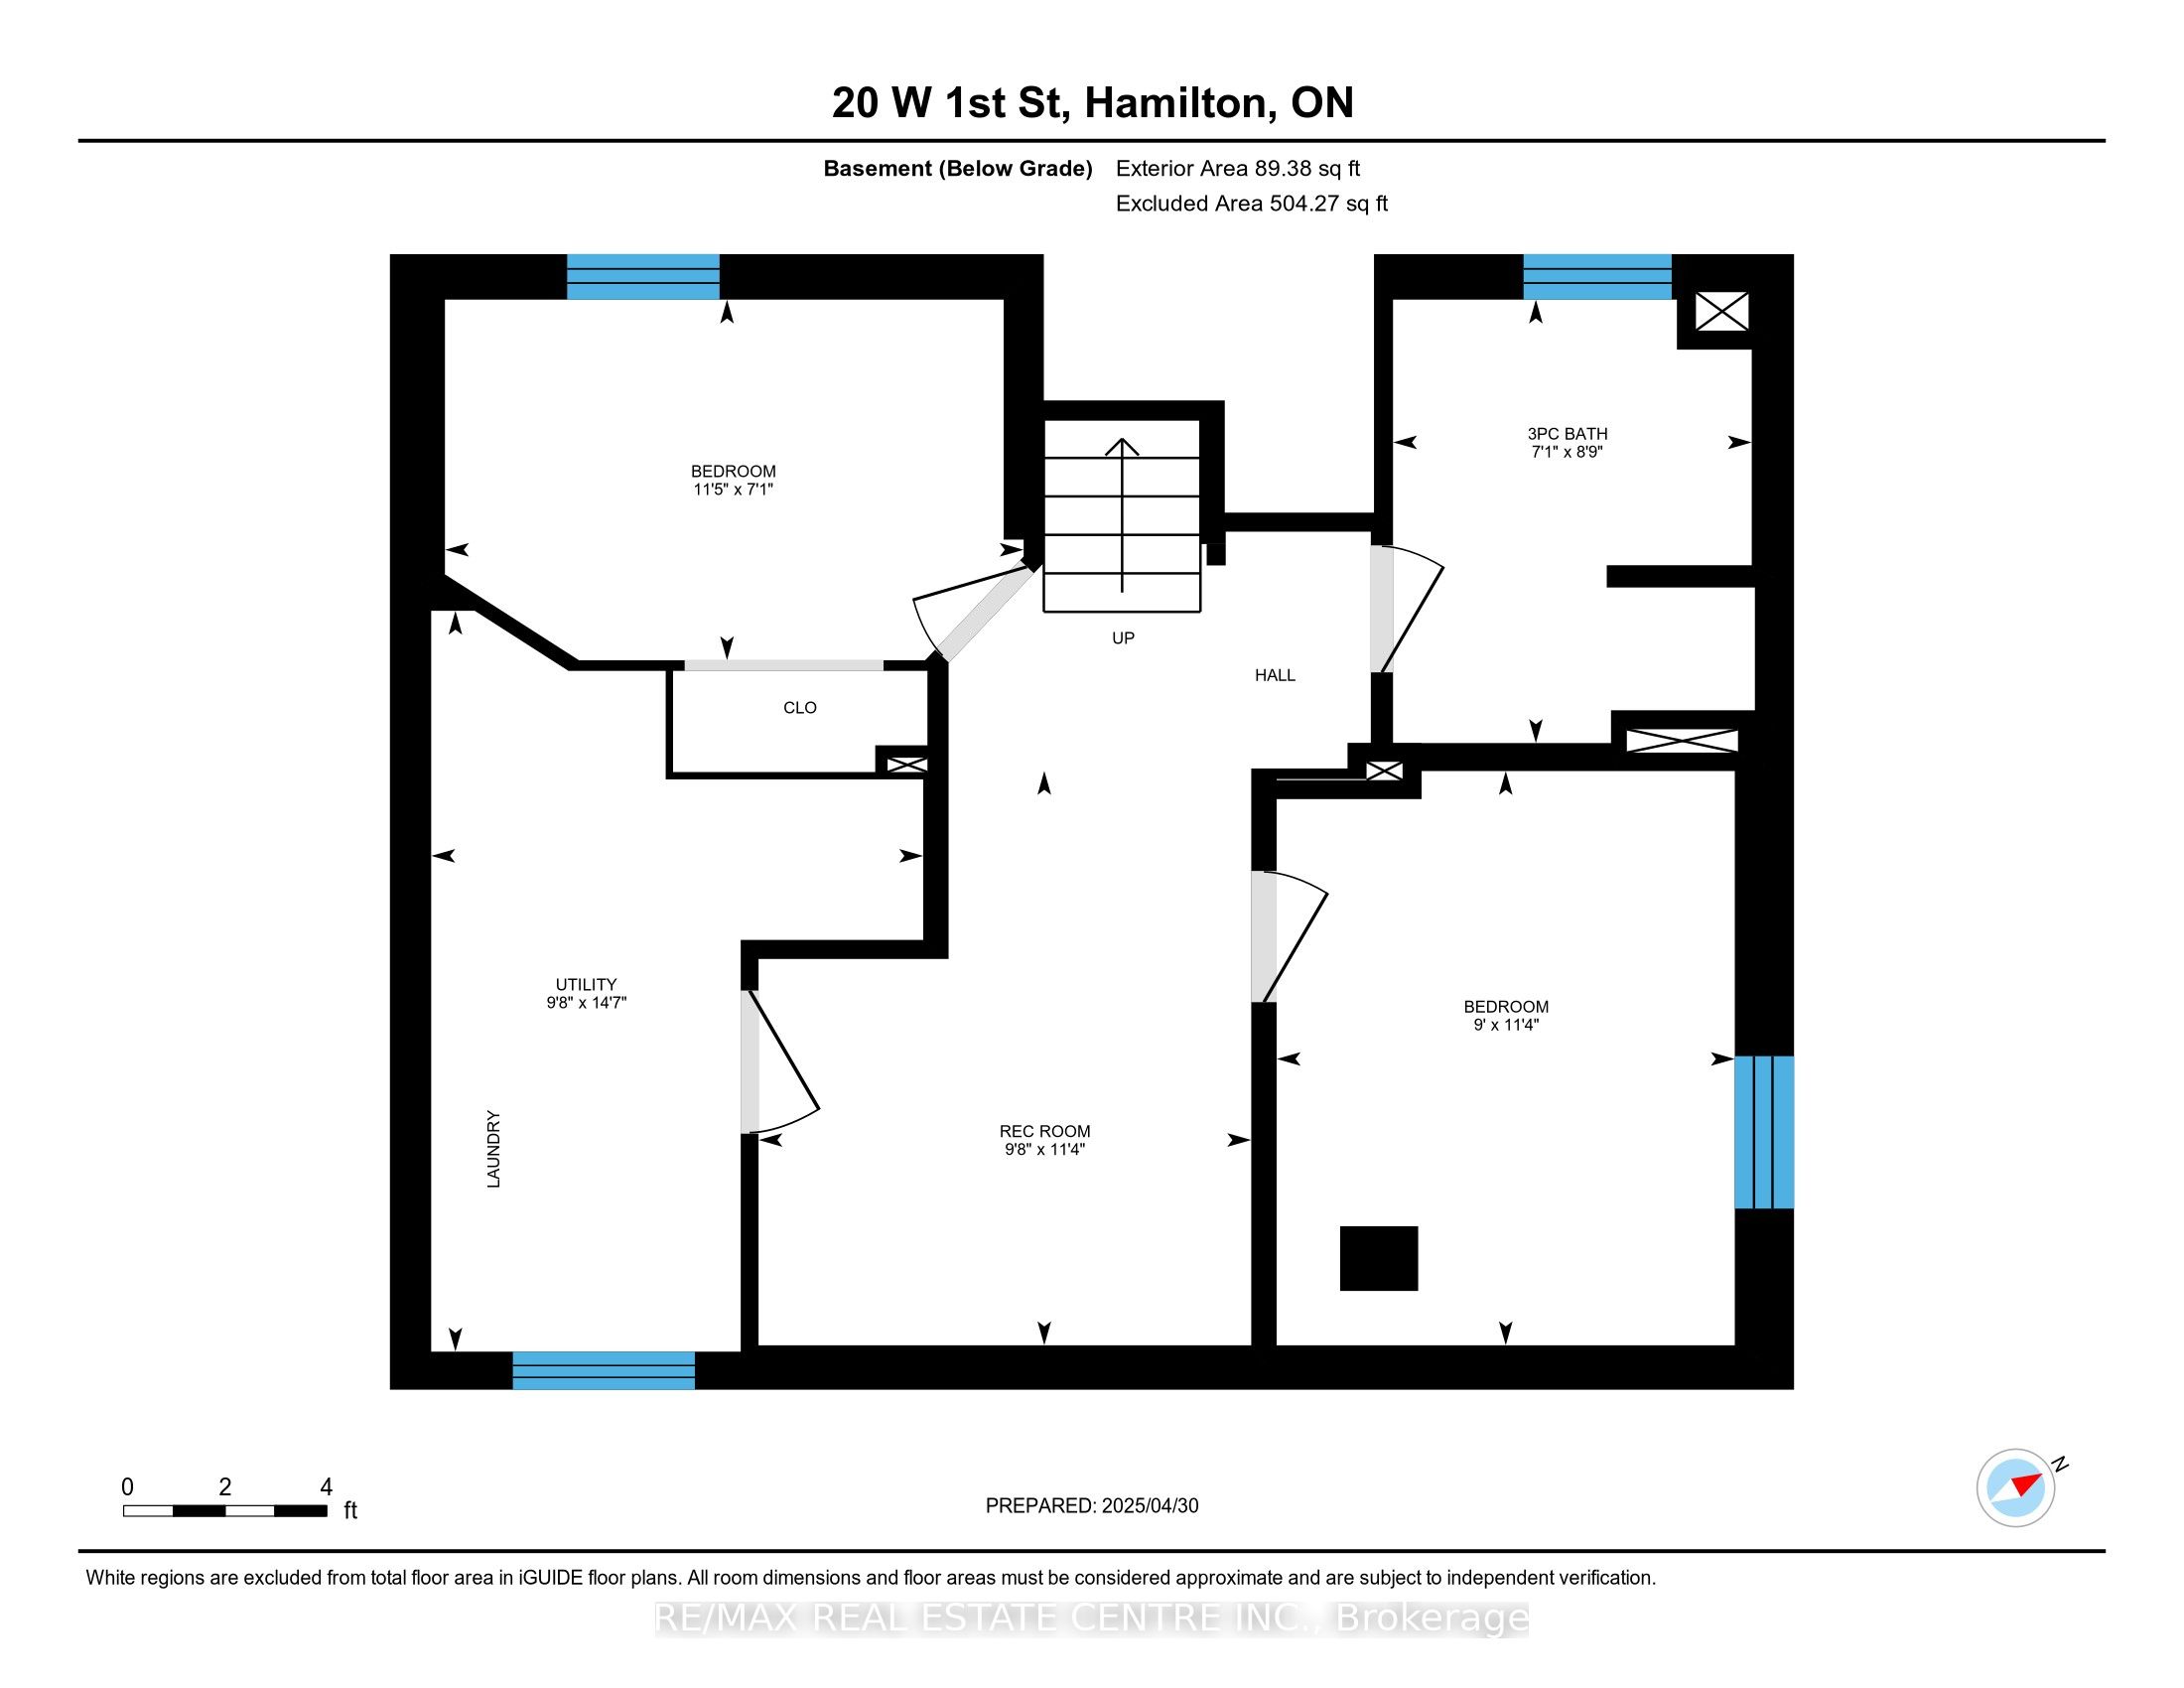
- Full Basement
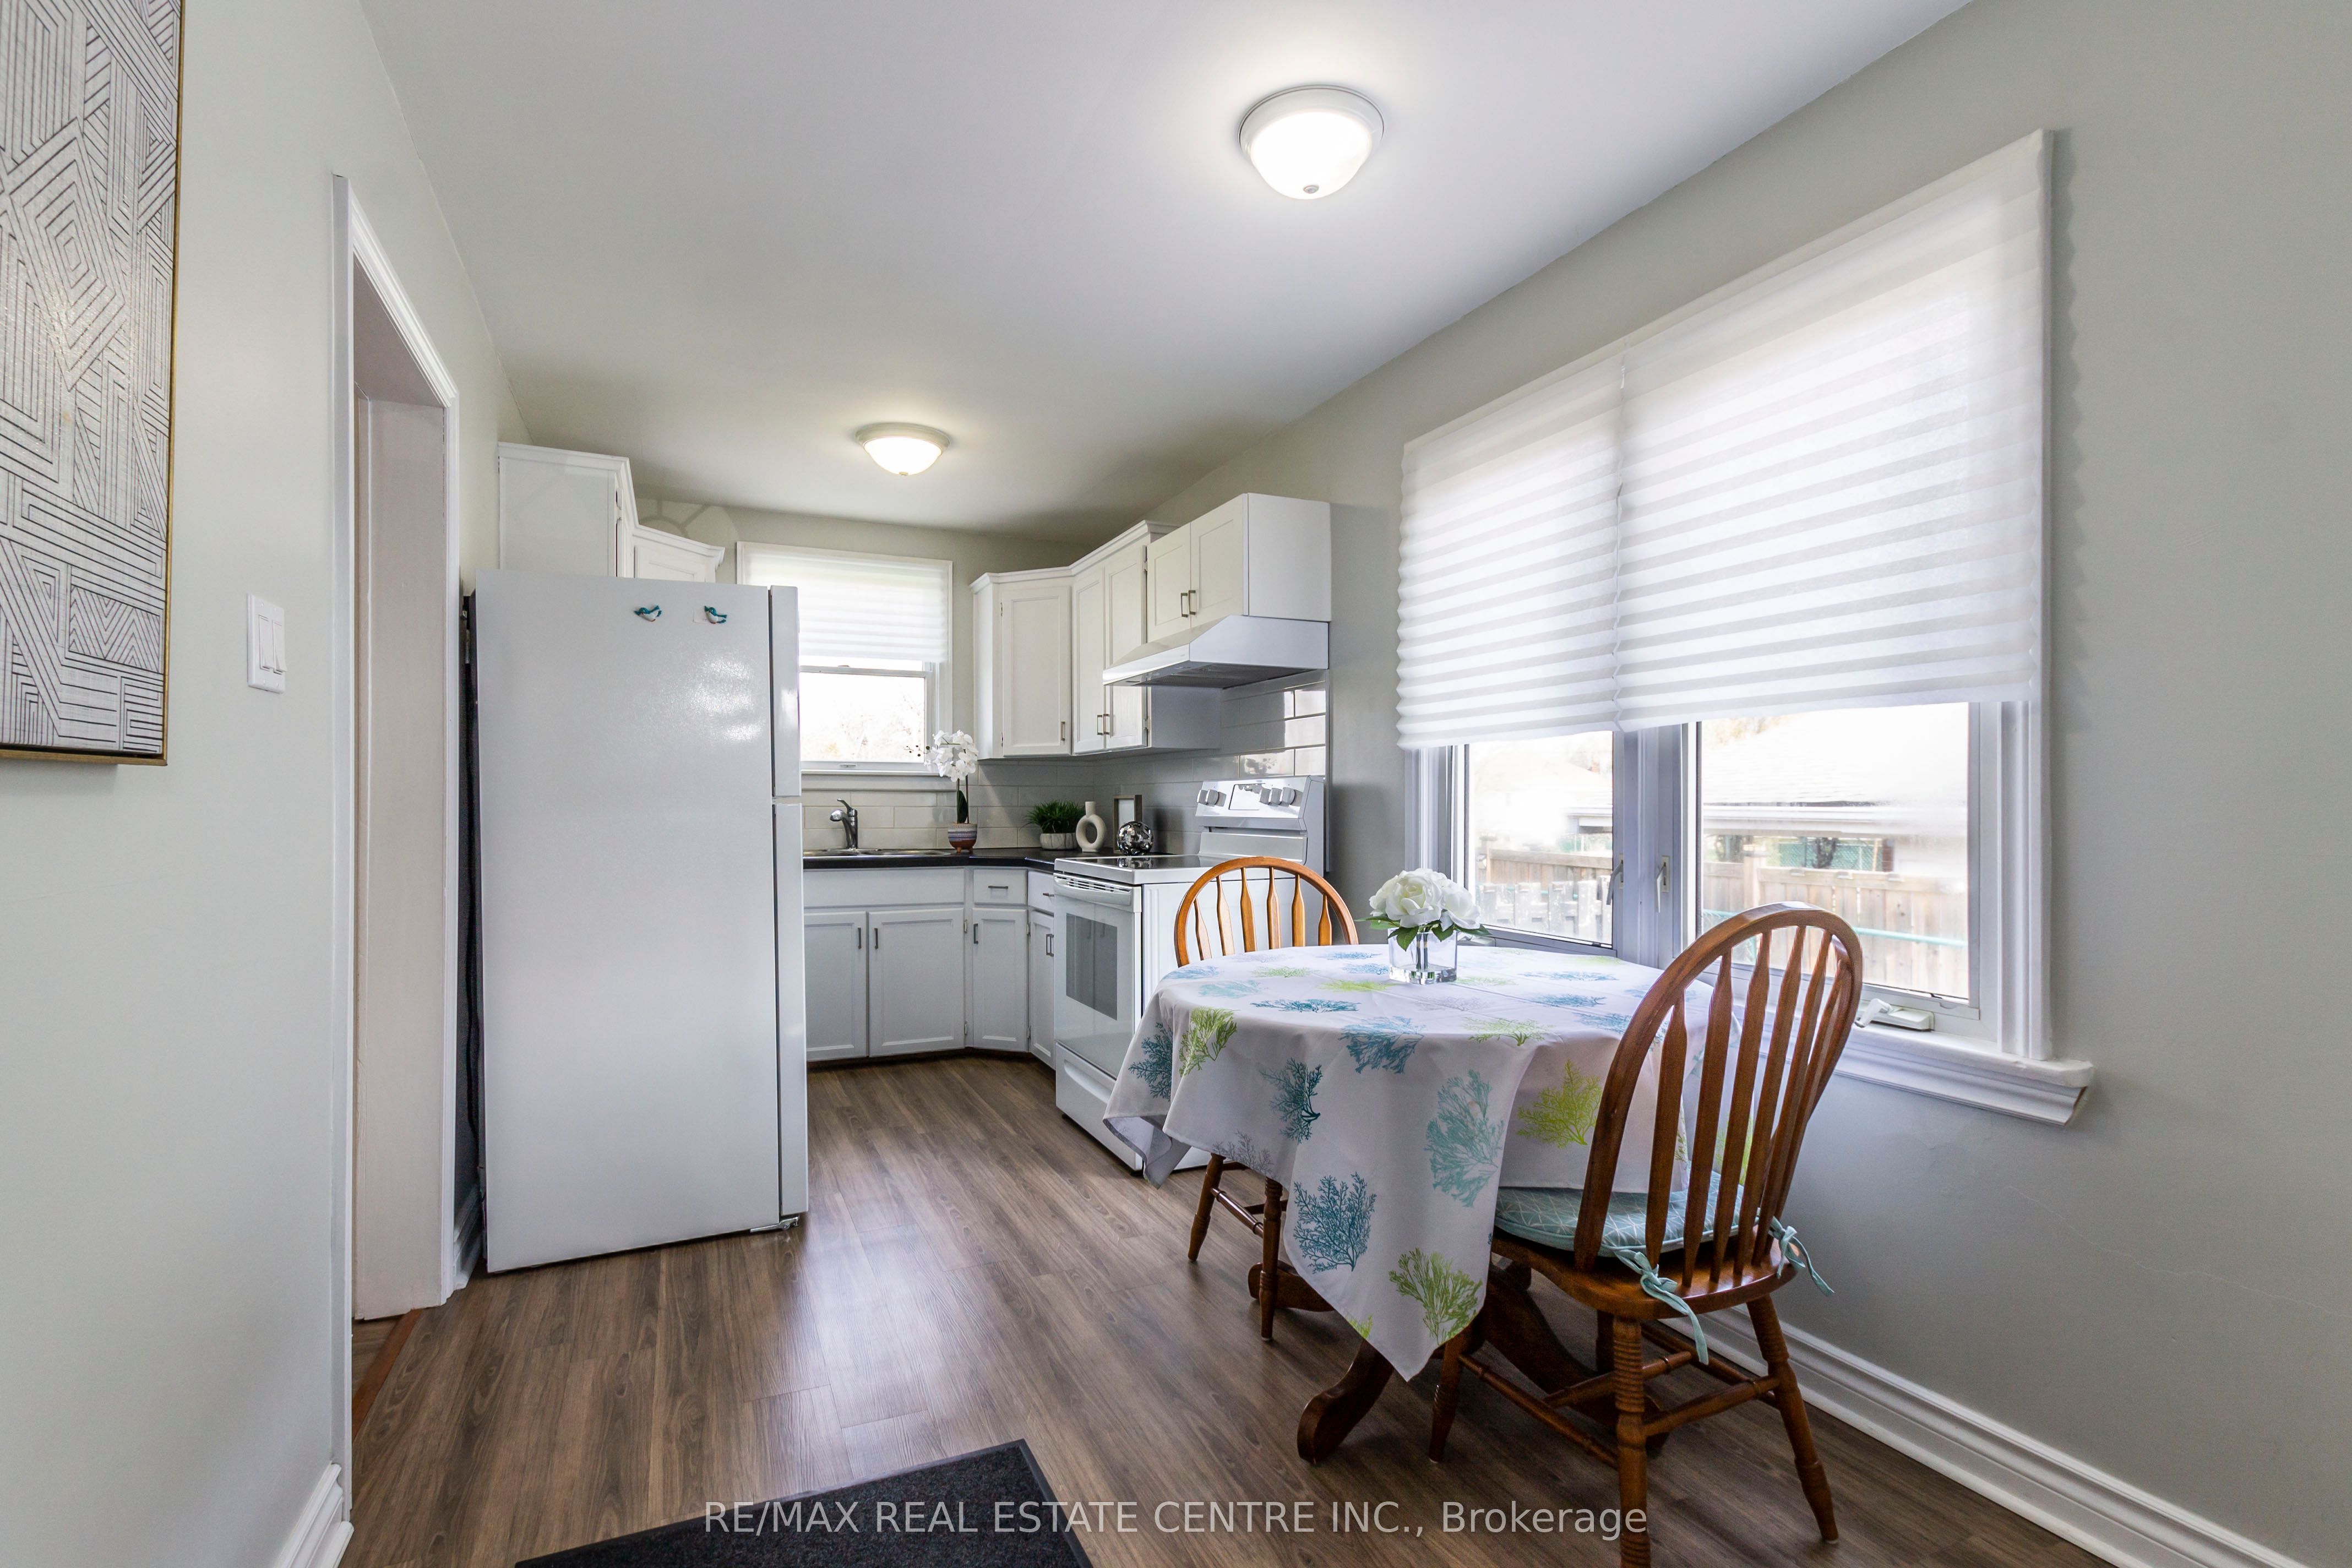
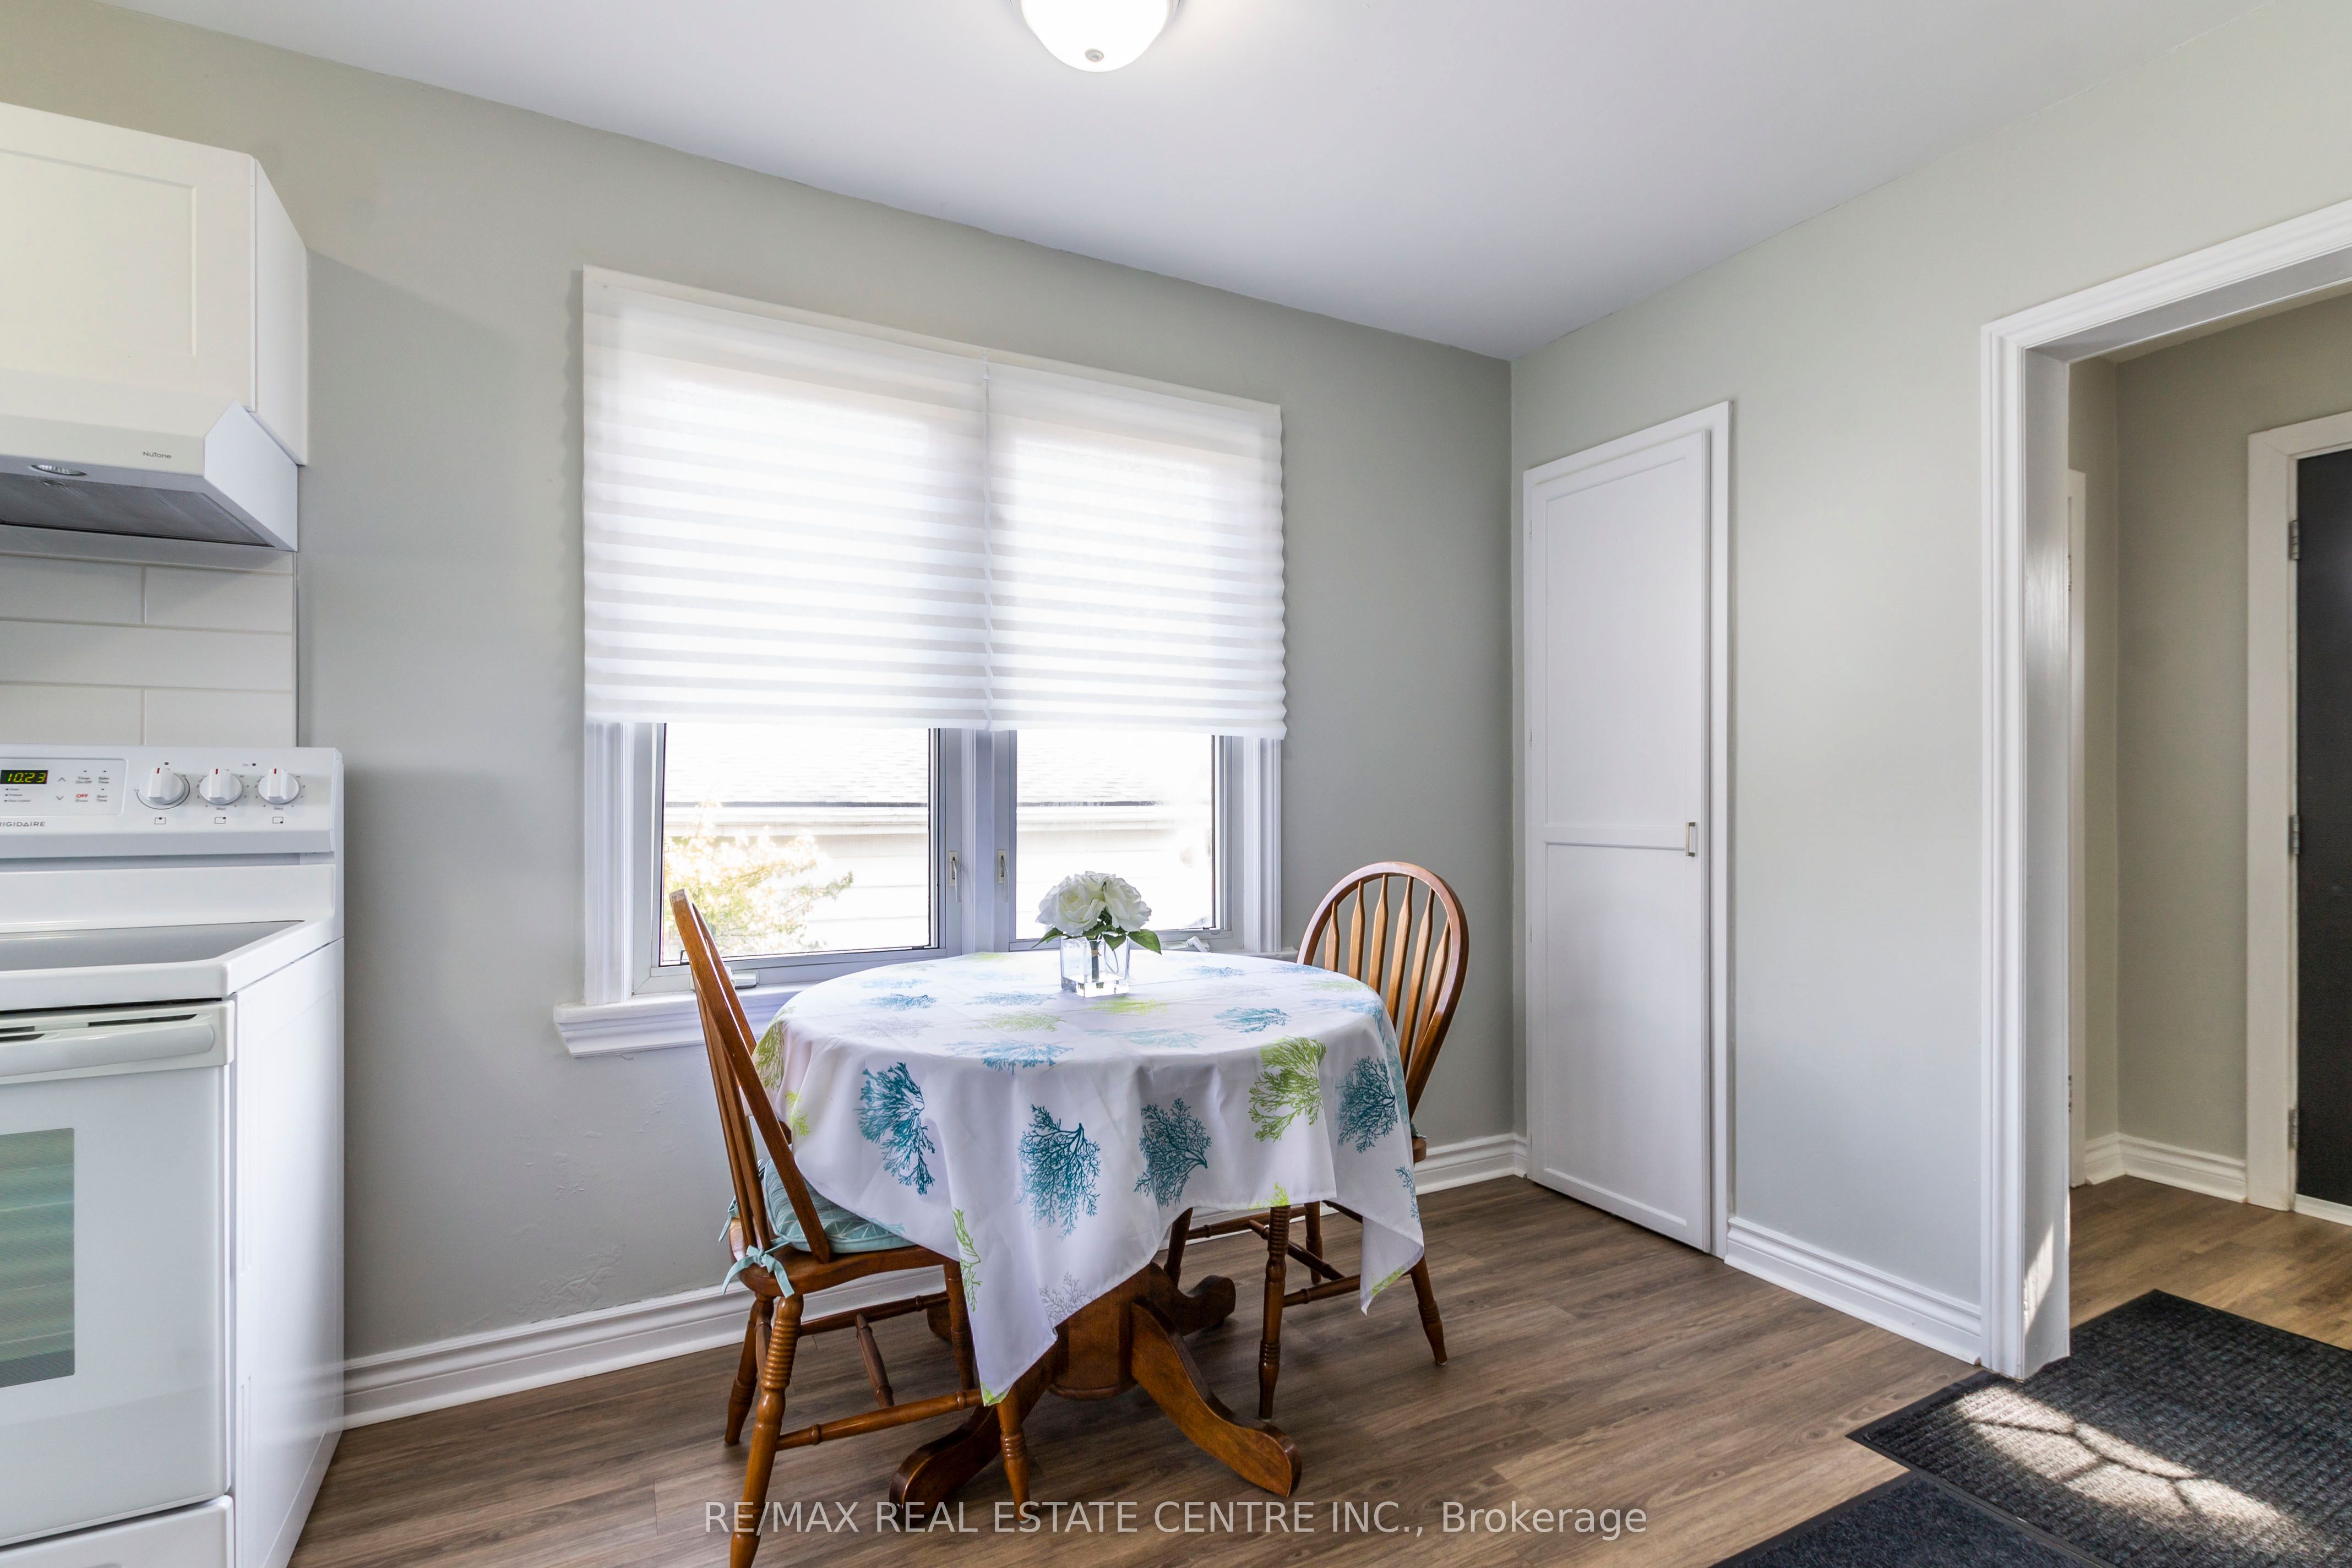
- 1 Kitchen
- Forced Air Gas Heating
- Central Air
Property
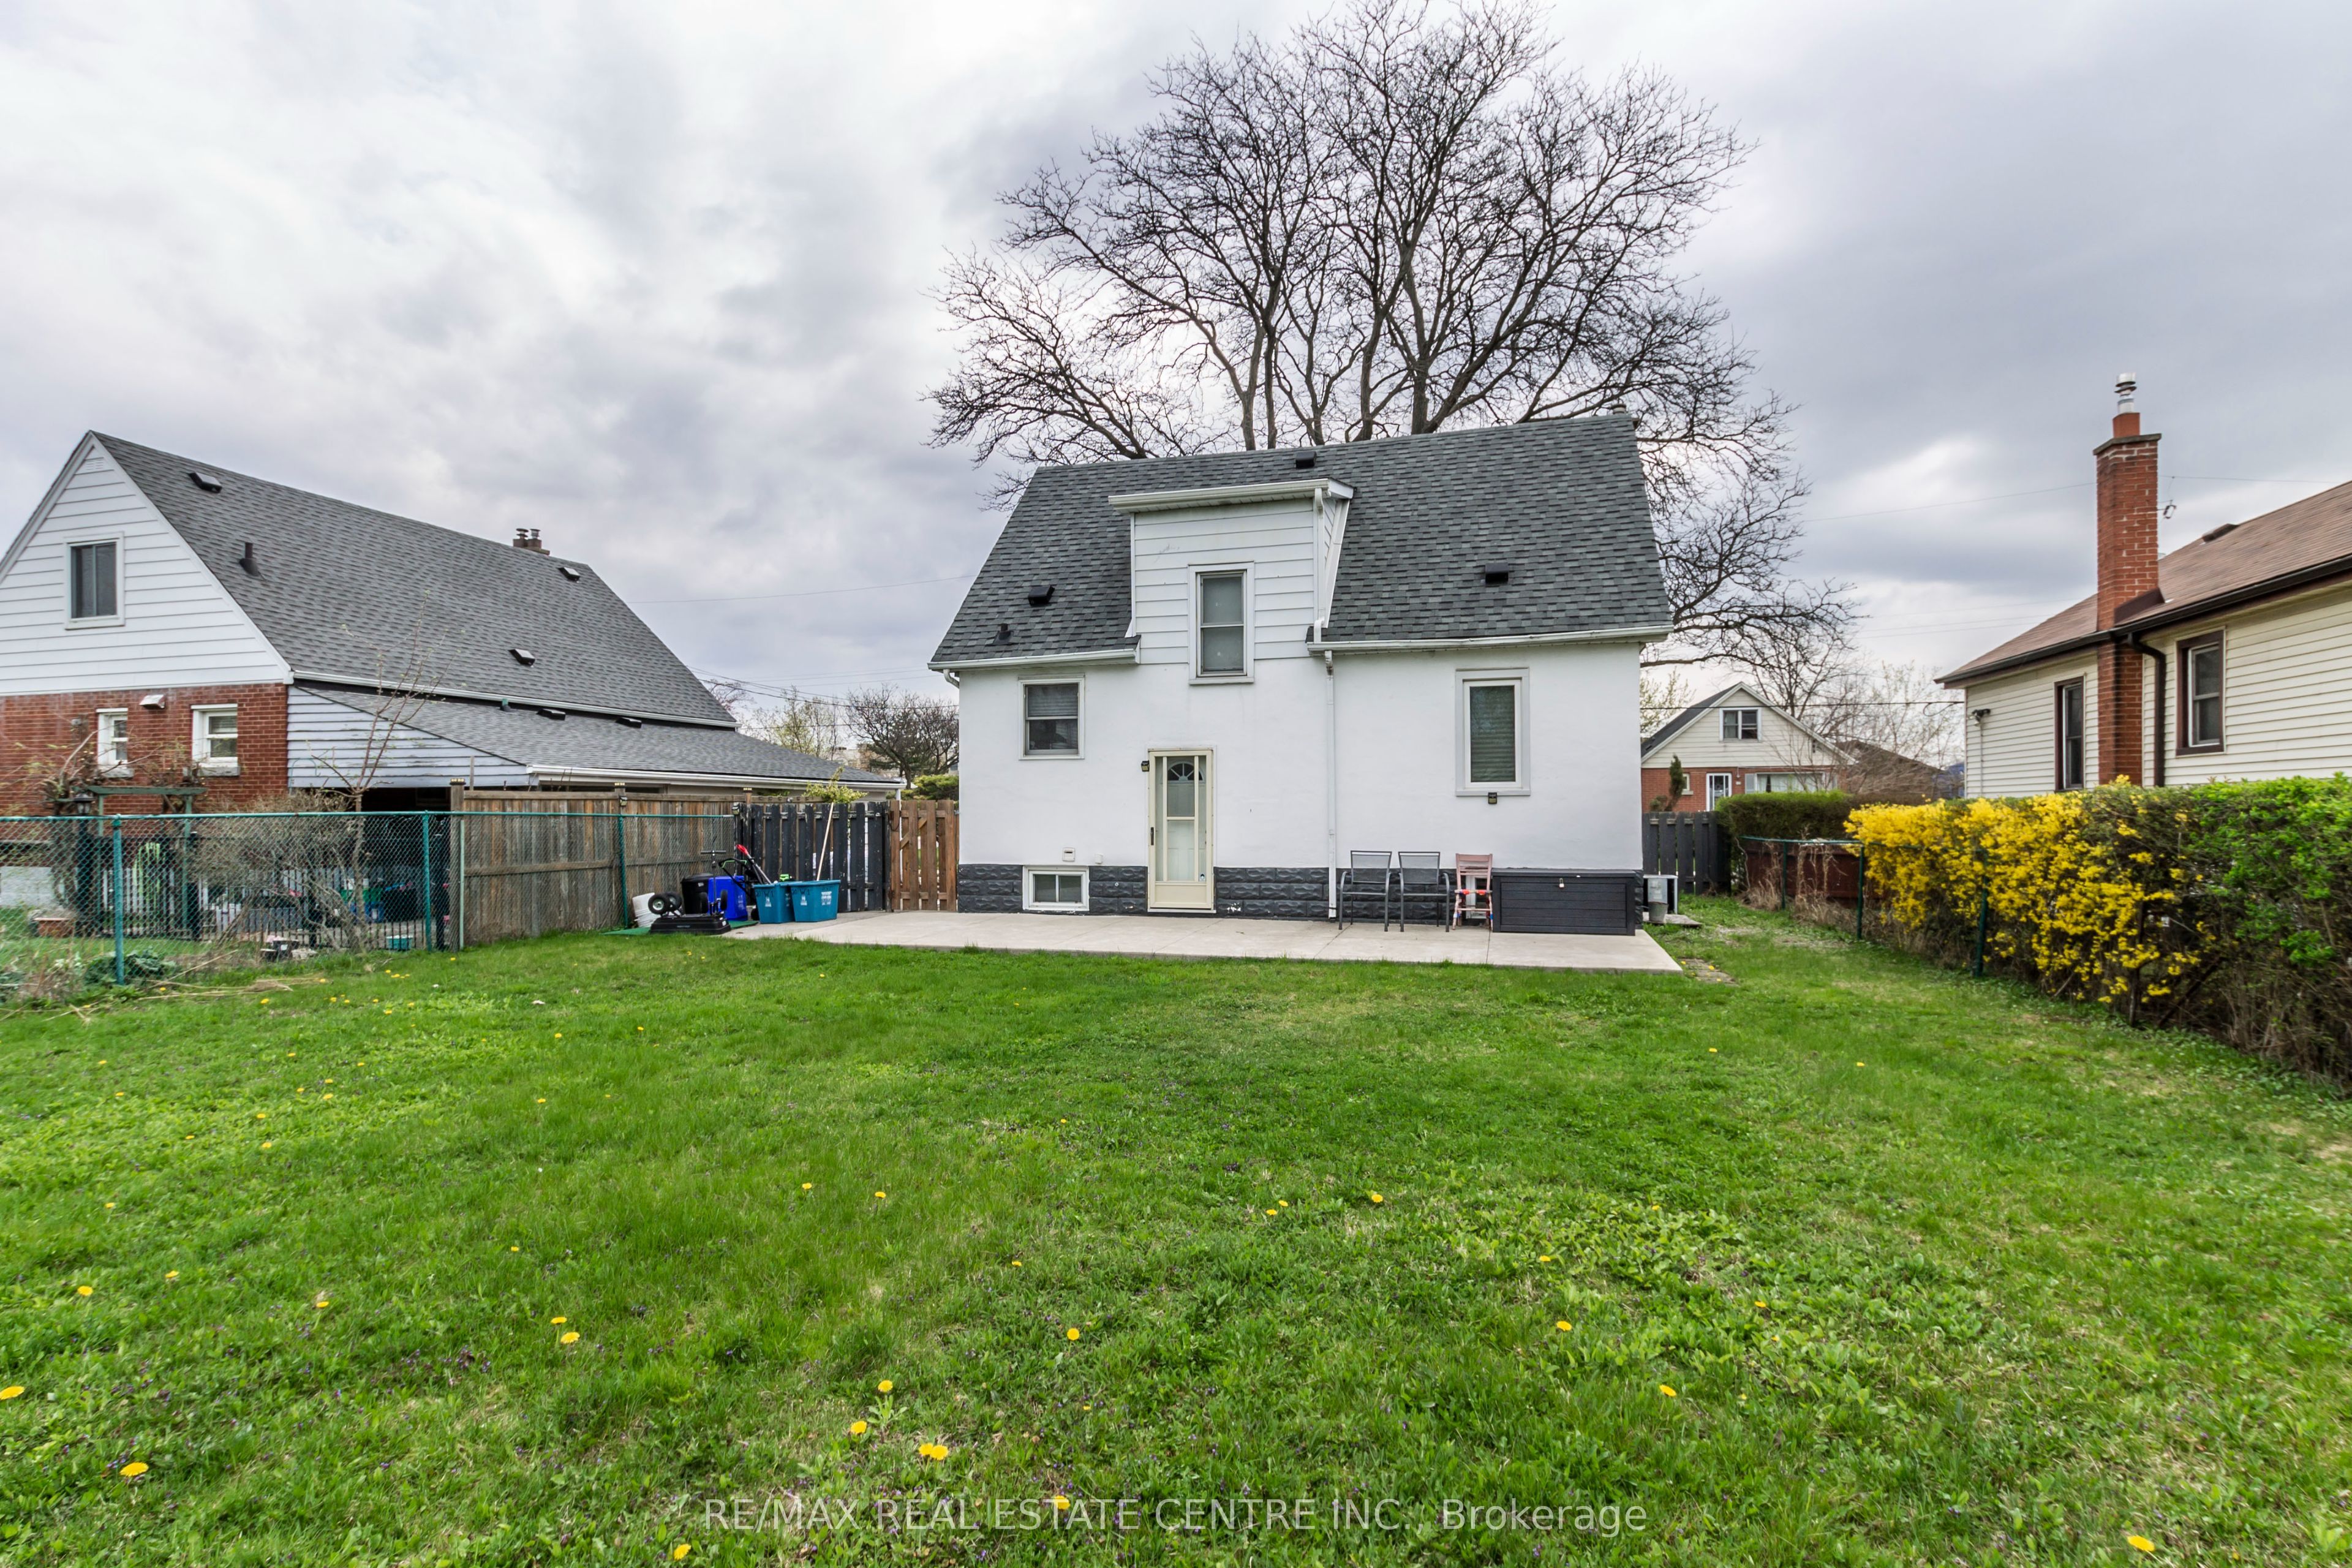
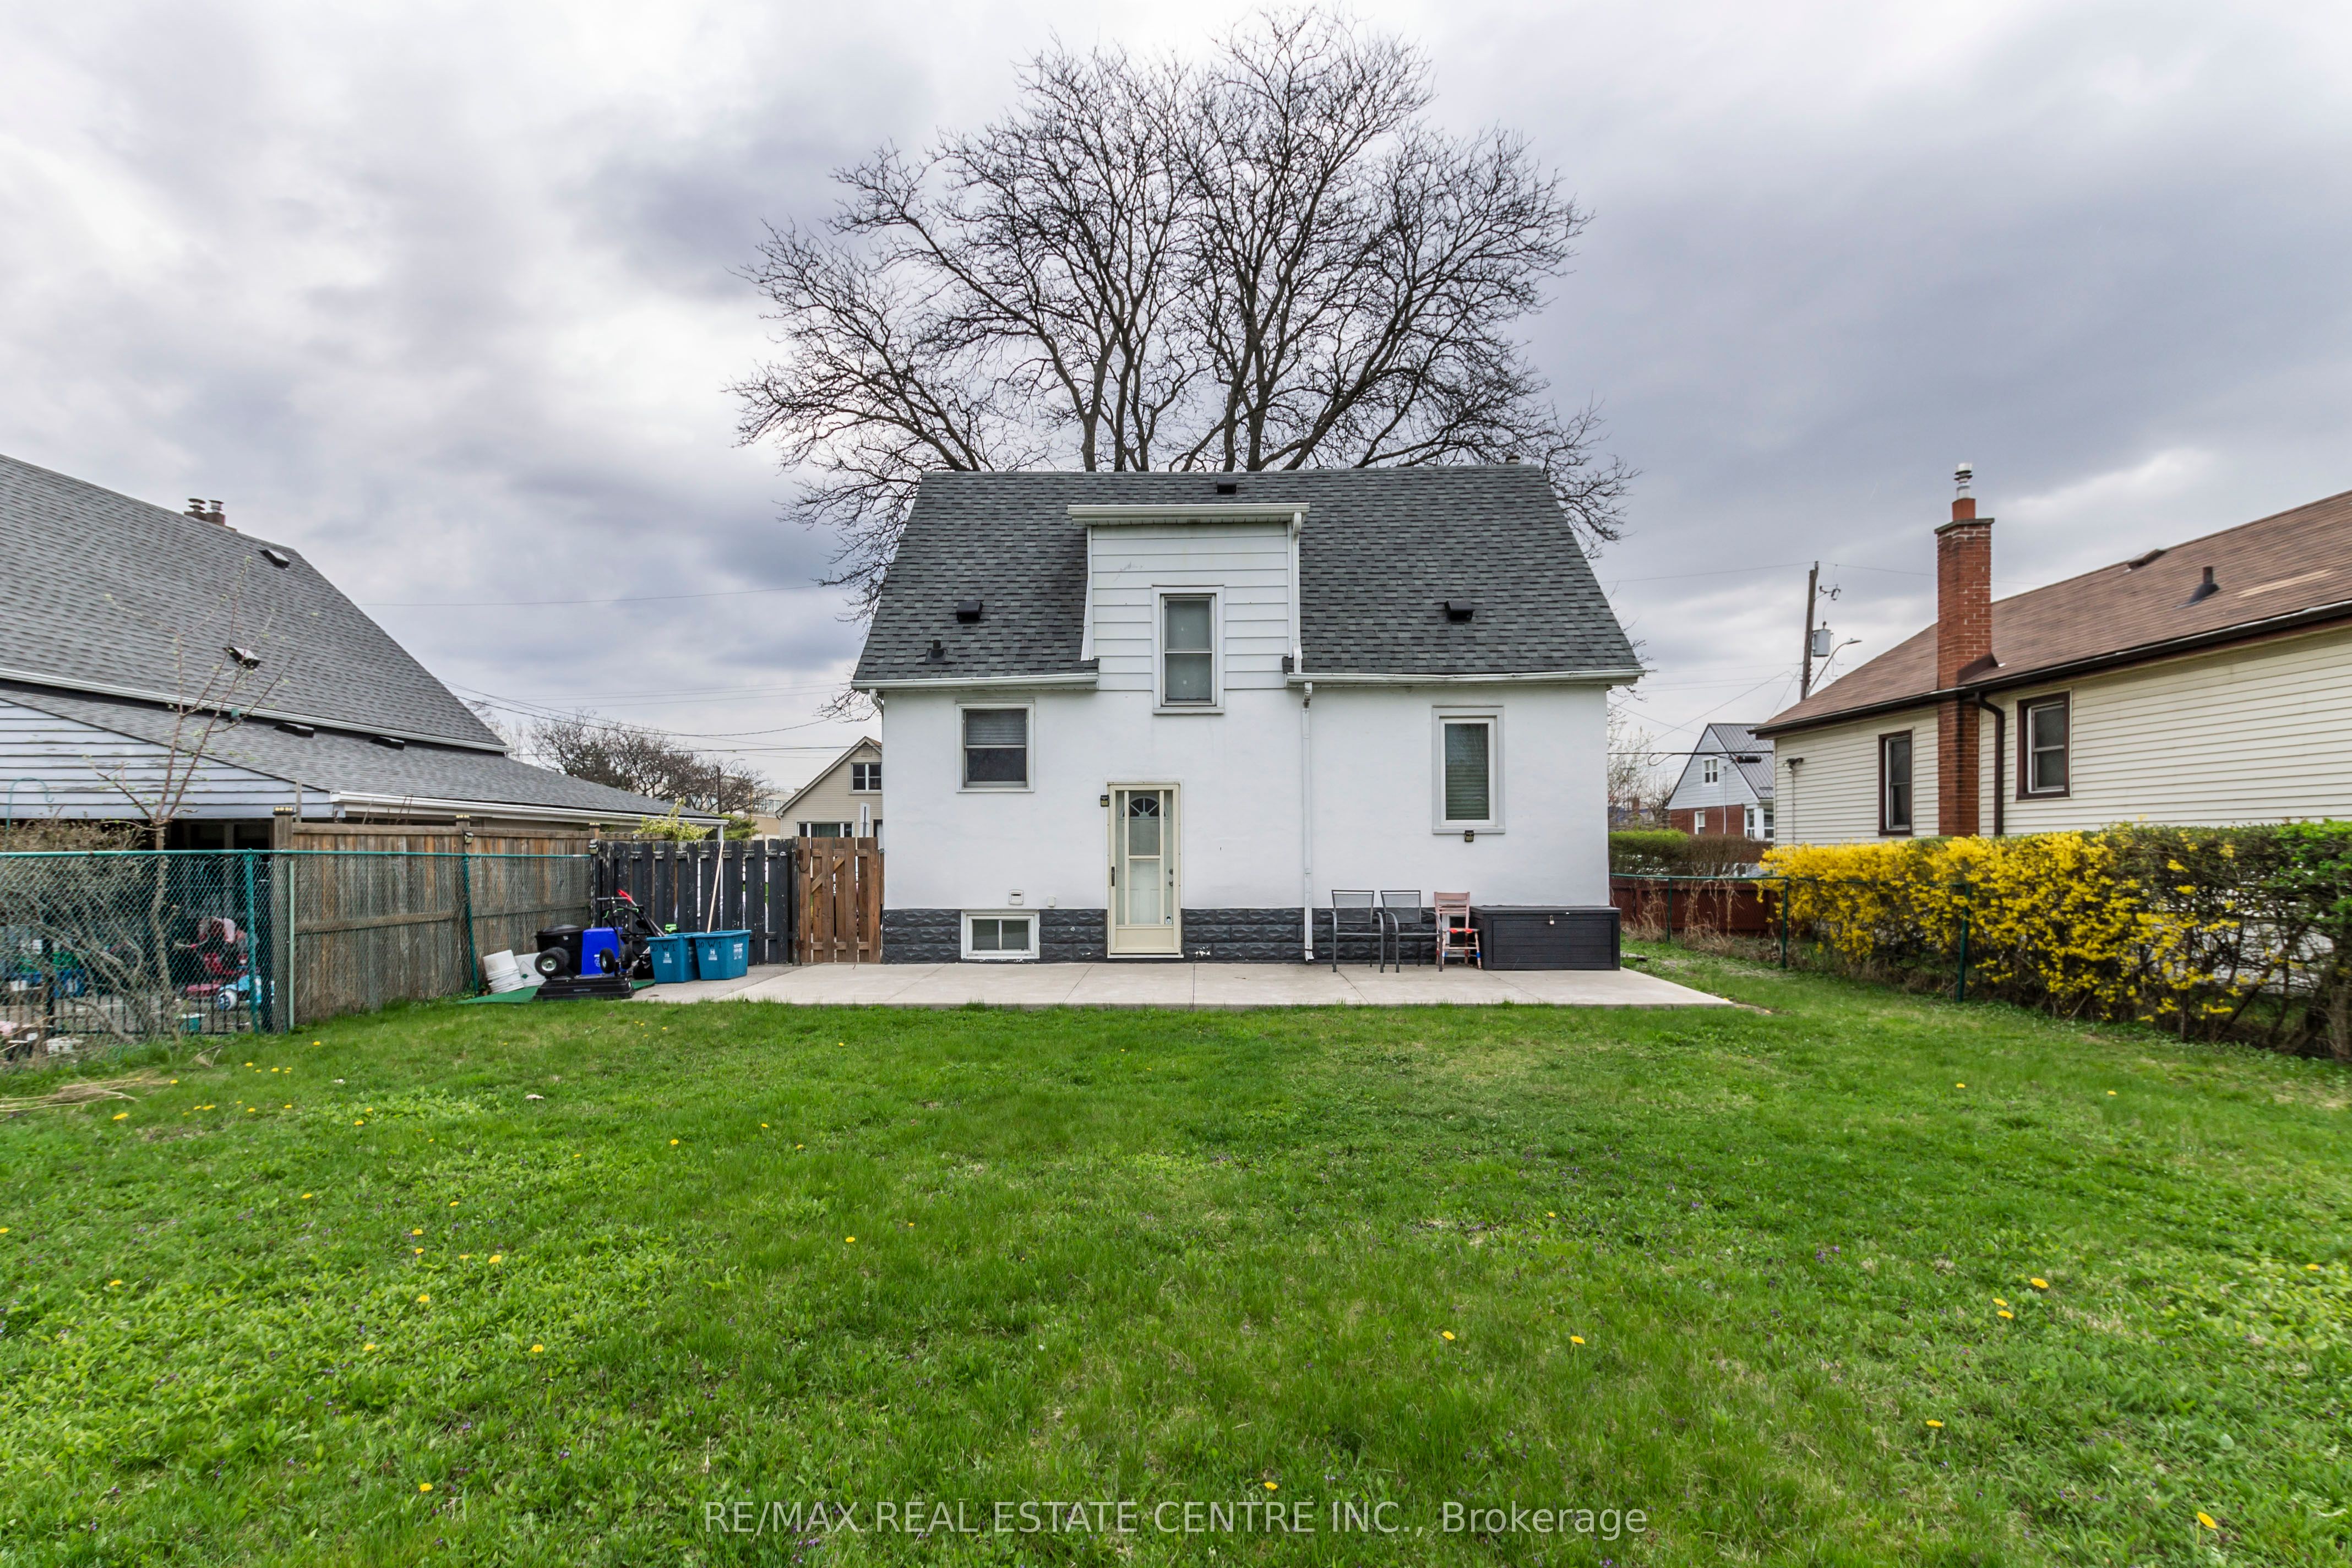
- Lot Size 50 x 105.75 Feet
- Aluminum Siding Exterior
- Taxes were $2,078 in 2025
- Possession: FLEXIBLE
Details
- No Fireplace
- No Family Room
- Sewers
- Municipal Water
- MLS #X12745368
- RE/MAX REAL ESTATE CENTRE INC.
Extras
Rooms
| Room | Floor | Dimensions | Details | |
|---|---|---|---|---|
| 1 | Kitchen | Main | 7.51' x 7.84' | |
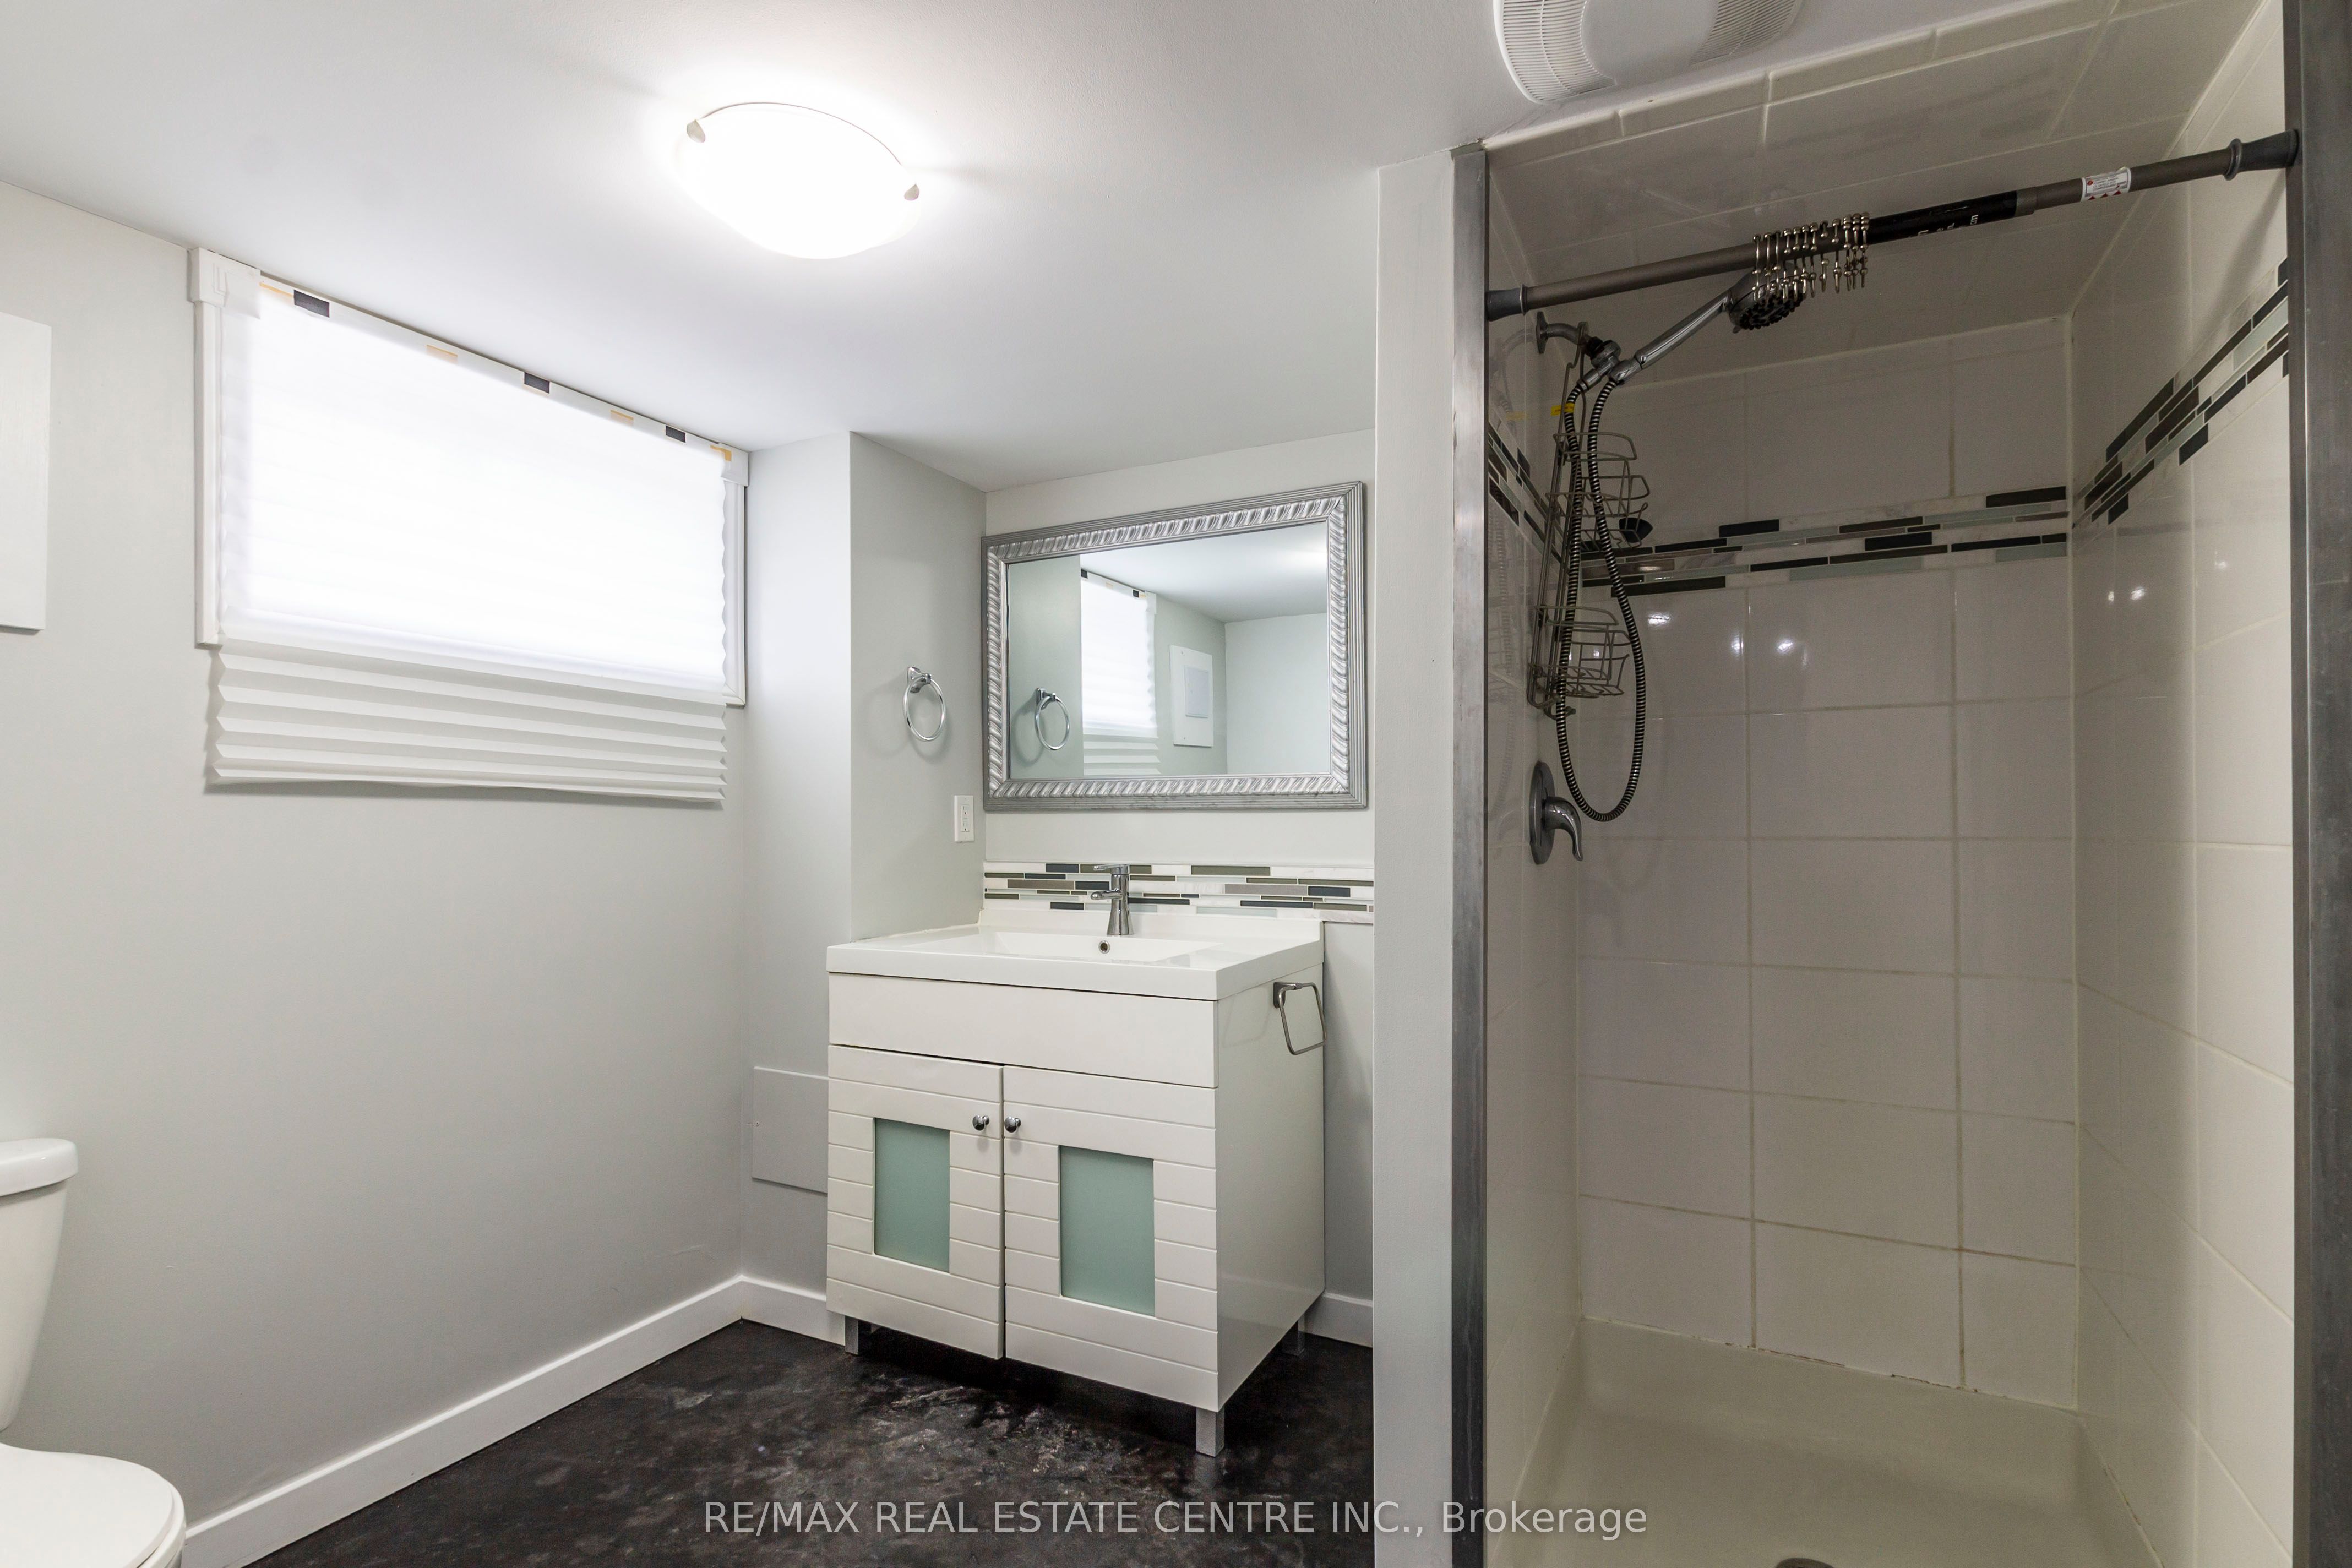
 | 1 3-Piece Bathroom | |||
How Far is Too Far?
See personalized commute details for each listing by adding your favourite places (like work or daycare) and mode of travel.
Sign up to see commute timesAlready signed up? Sign in
Who lives here?
Bonnington, Hamilton is a west GTA neighbourhood notable for its singles, renters, health professionals and salespeople. It has a higher than average population of immigrants from the Philippines, and Punjabi and Tagalog speakers. Residents tend to be younger with a significant number of youth aged 15 to 24 and adults aged 25 to 34.
Families
Kids Per Family
1.1
kids per family
in the neighbourhood.
Singles
64%
of residents are
single and loving it.
64% singles
Hamilton (46%)Renters
63%
of residents
are renters.
63% renters
Hamilton (32%)Education
24%
of residents are
university grads.
24% university grads
Hamilton (28%)Income
Average Household Income
$72K
is the average household
income in the neighbourhood.
Professions
Professions
| Sales | 25% |
| Trades | 9% |
| Business | 9% |
| Health | 6% |
| Manufacturing | 4% |
Immigrants
24%
of residents were
born outside of Canada.
24% immigrants
Hamilton (25%)Birthplace - All
6.9% from Philippines
All-time
Birthplace - Recent
0.3% from Lebanon
Recent
Foreign Languages
Foreign Languages
| Tagalog | 6% |
| Punjabi | 5% |
| Spanish | 2% |
| Arabic | 2% |
| French | 1% |
Religions
Religions
| Christian | 64% |
| Muslim | 4% |
| Sikh | 1% |
| Hindu | 1% |
| Jewish | 1% |