$1,800Asking Price
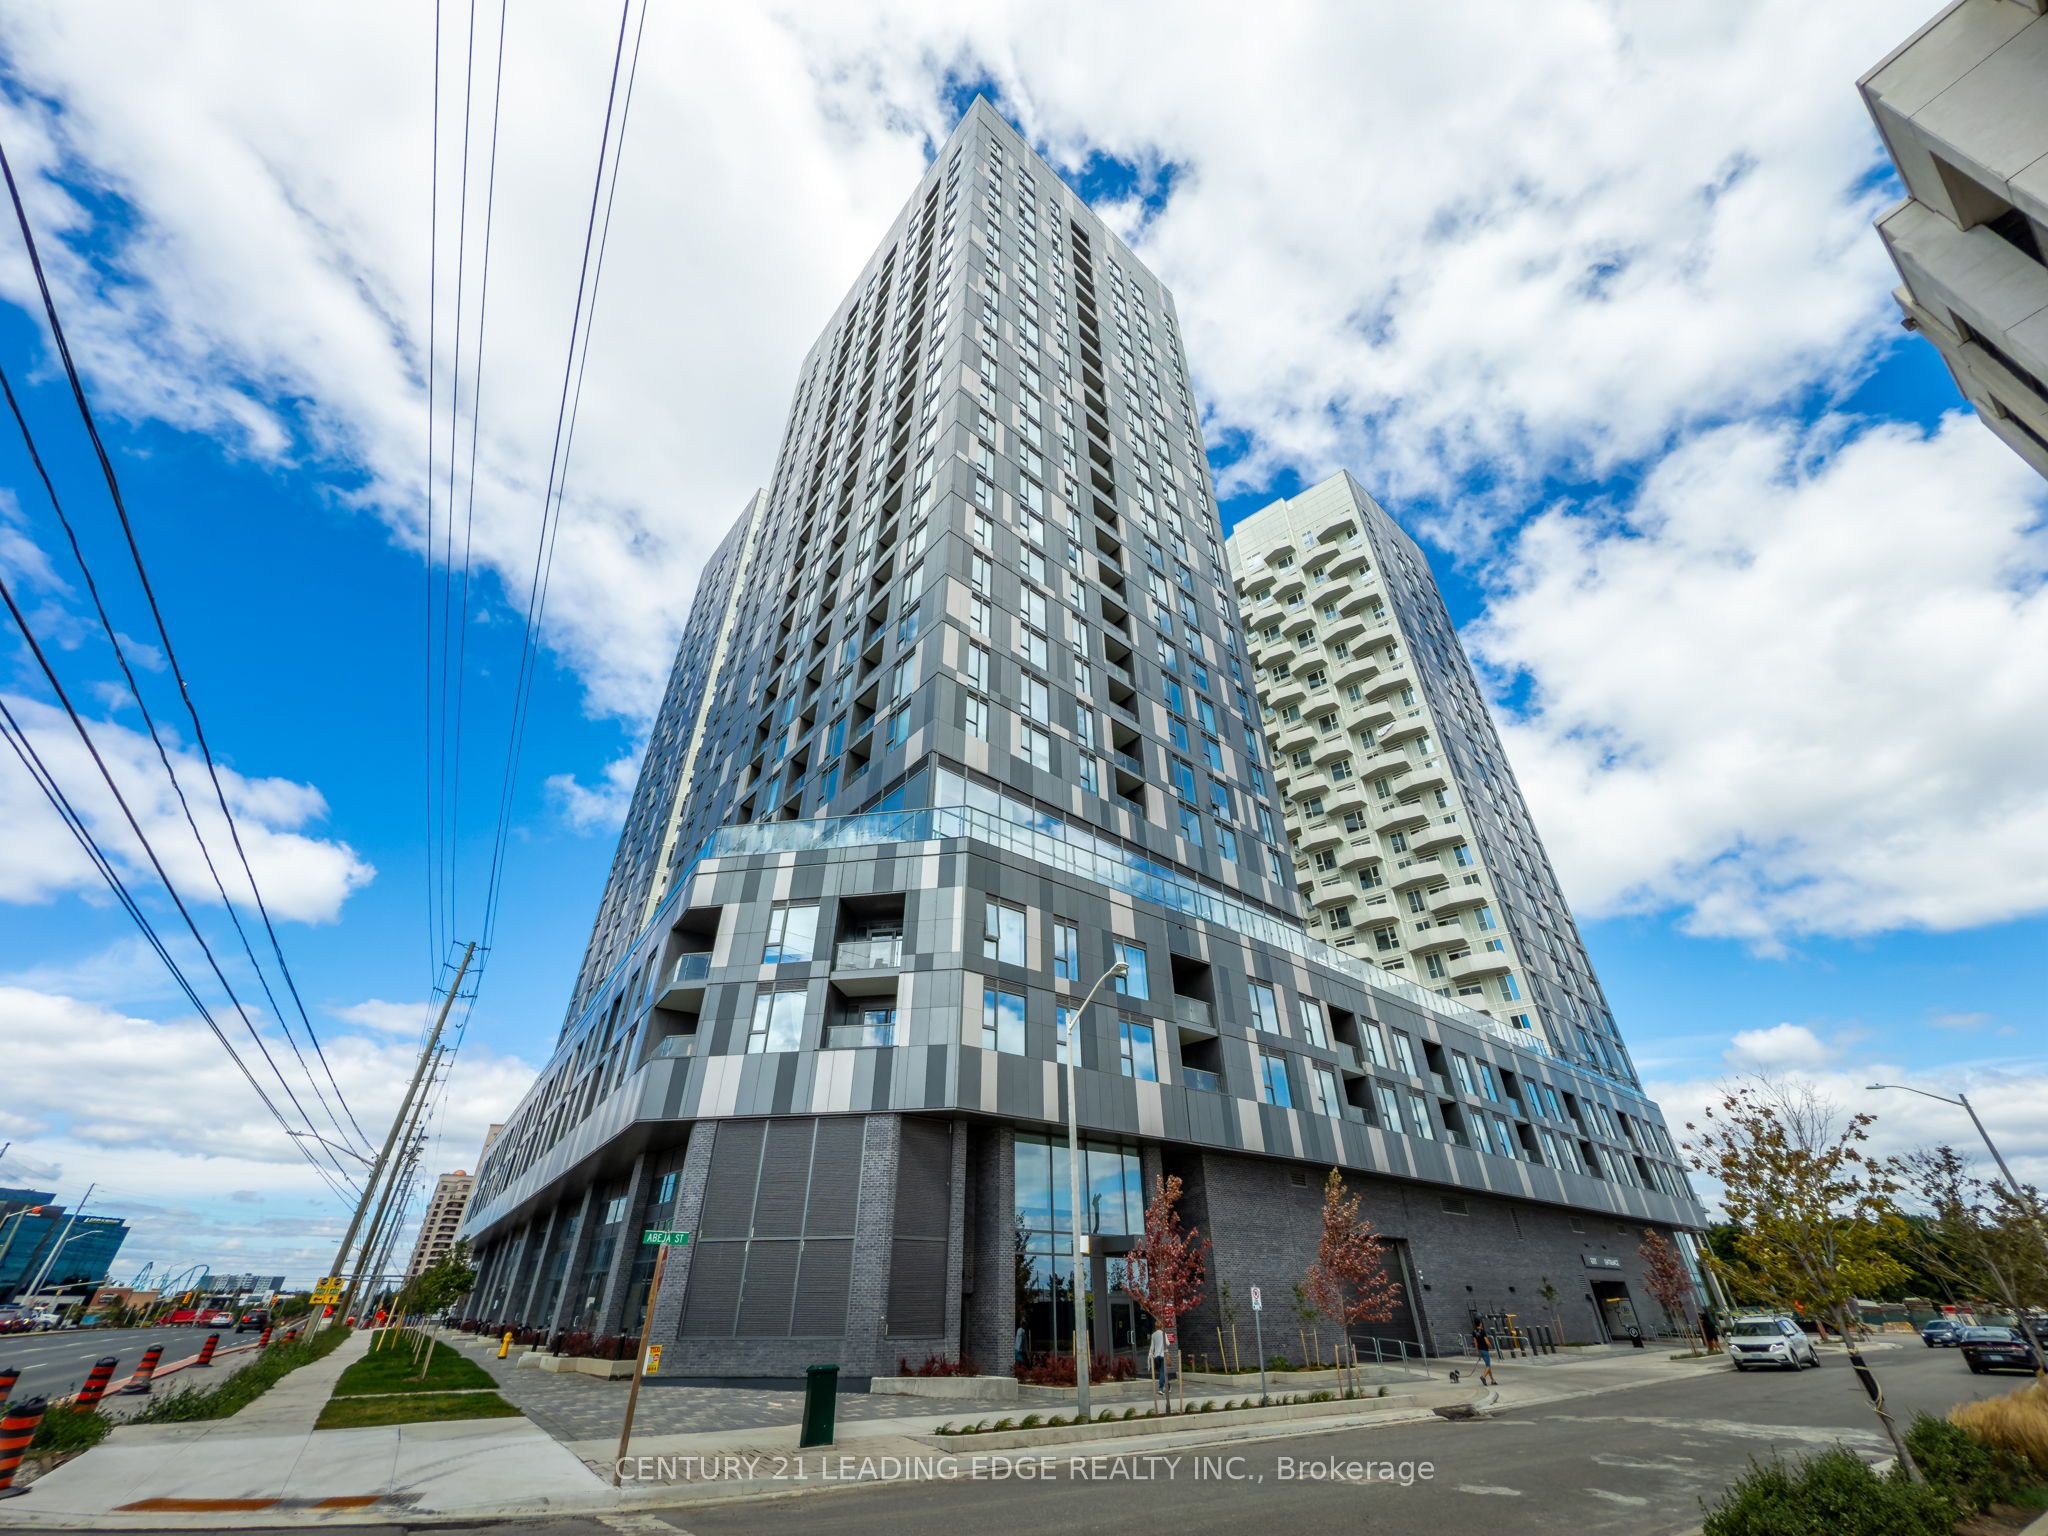
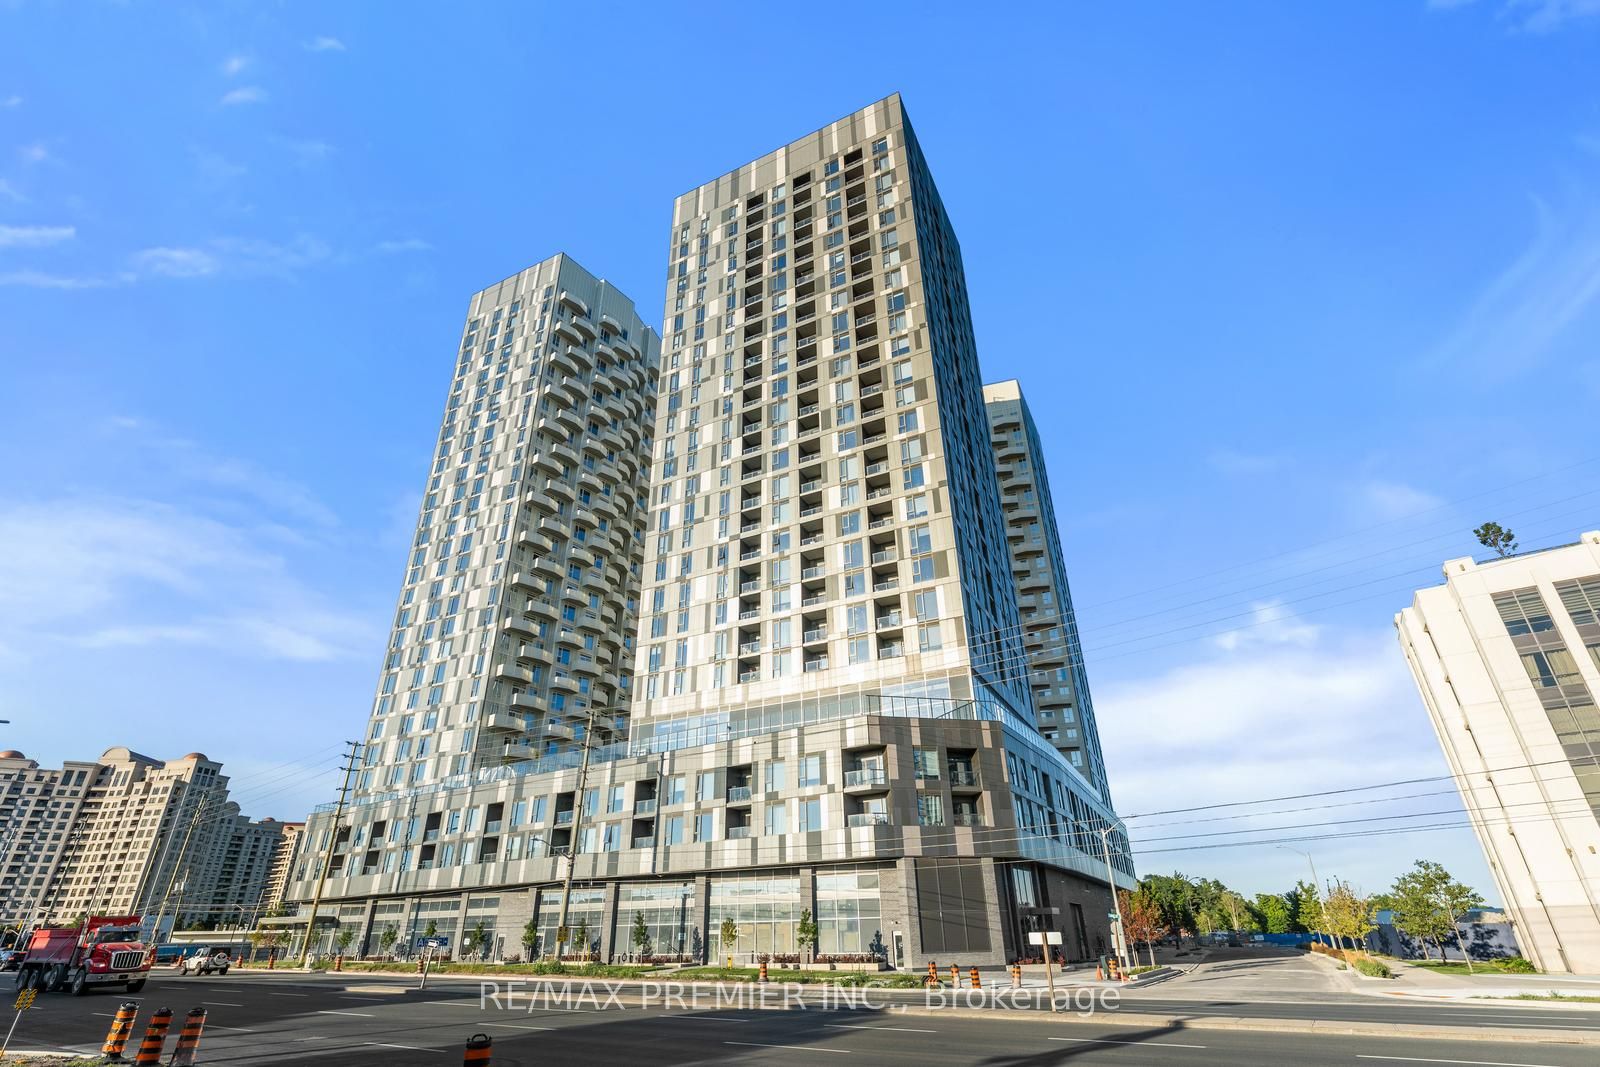
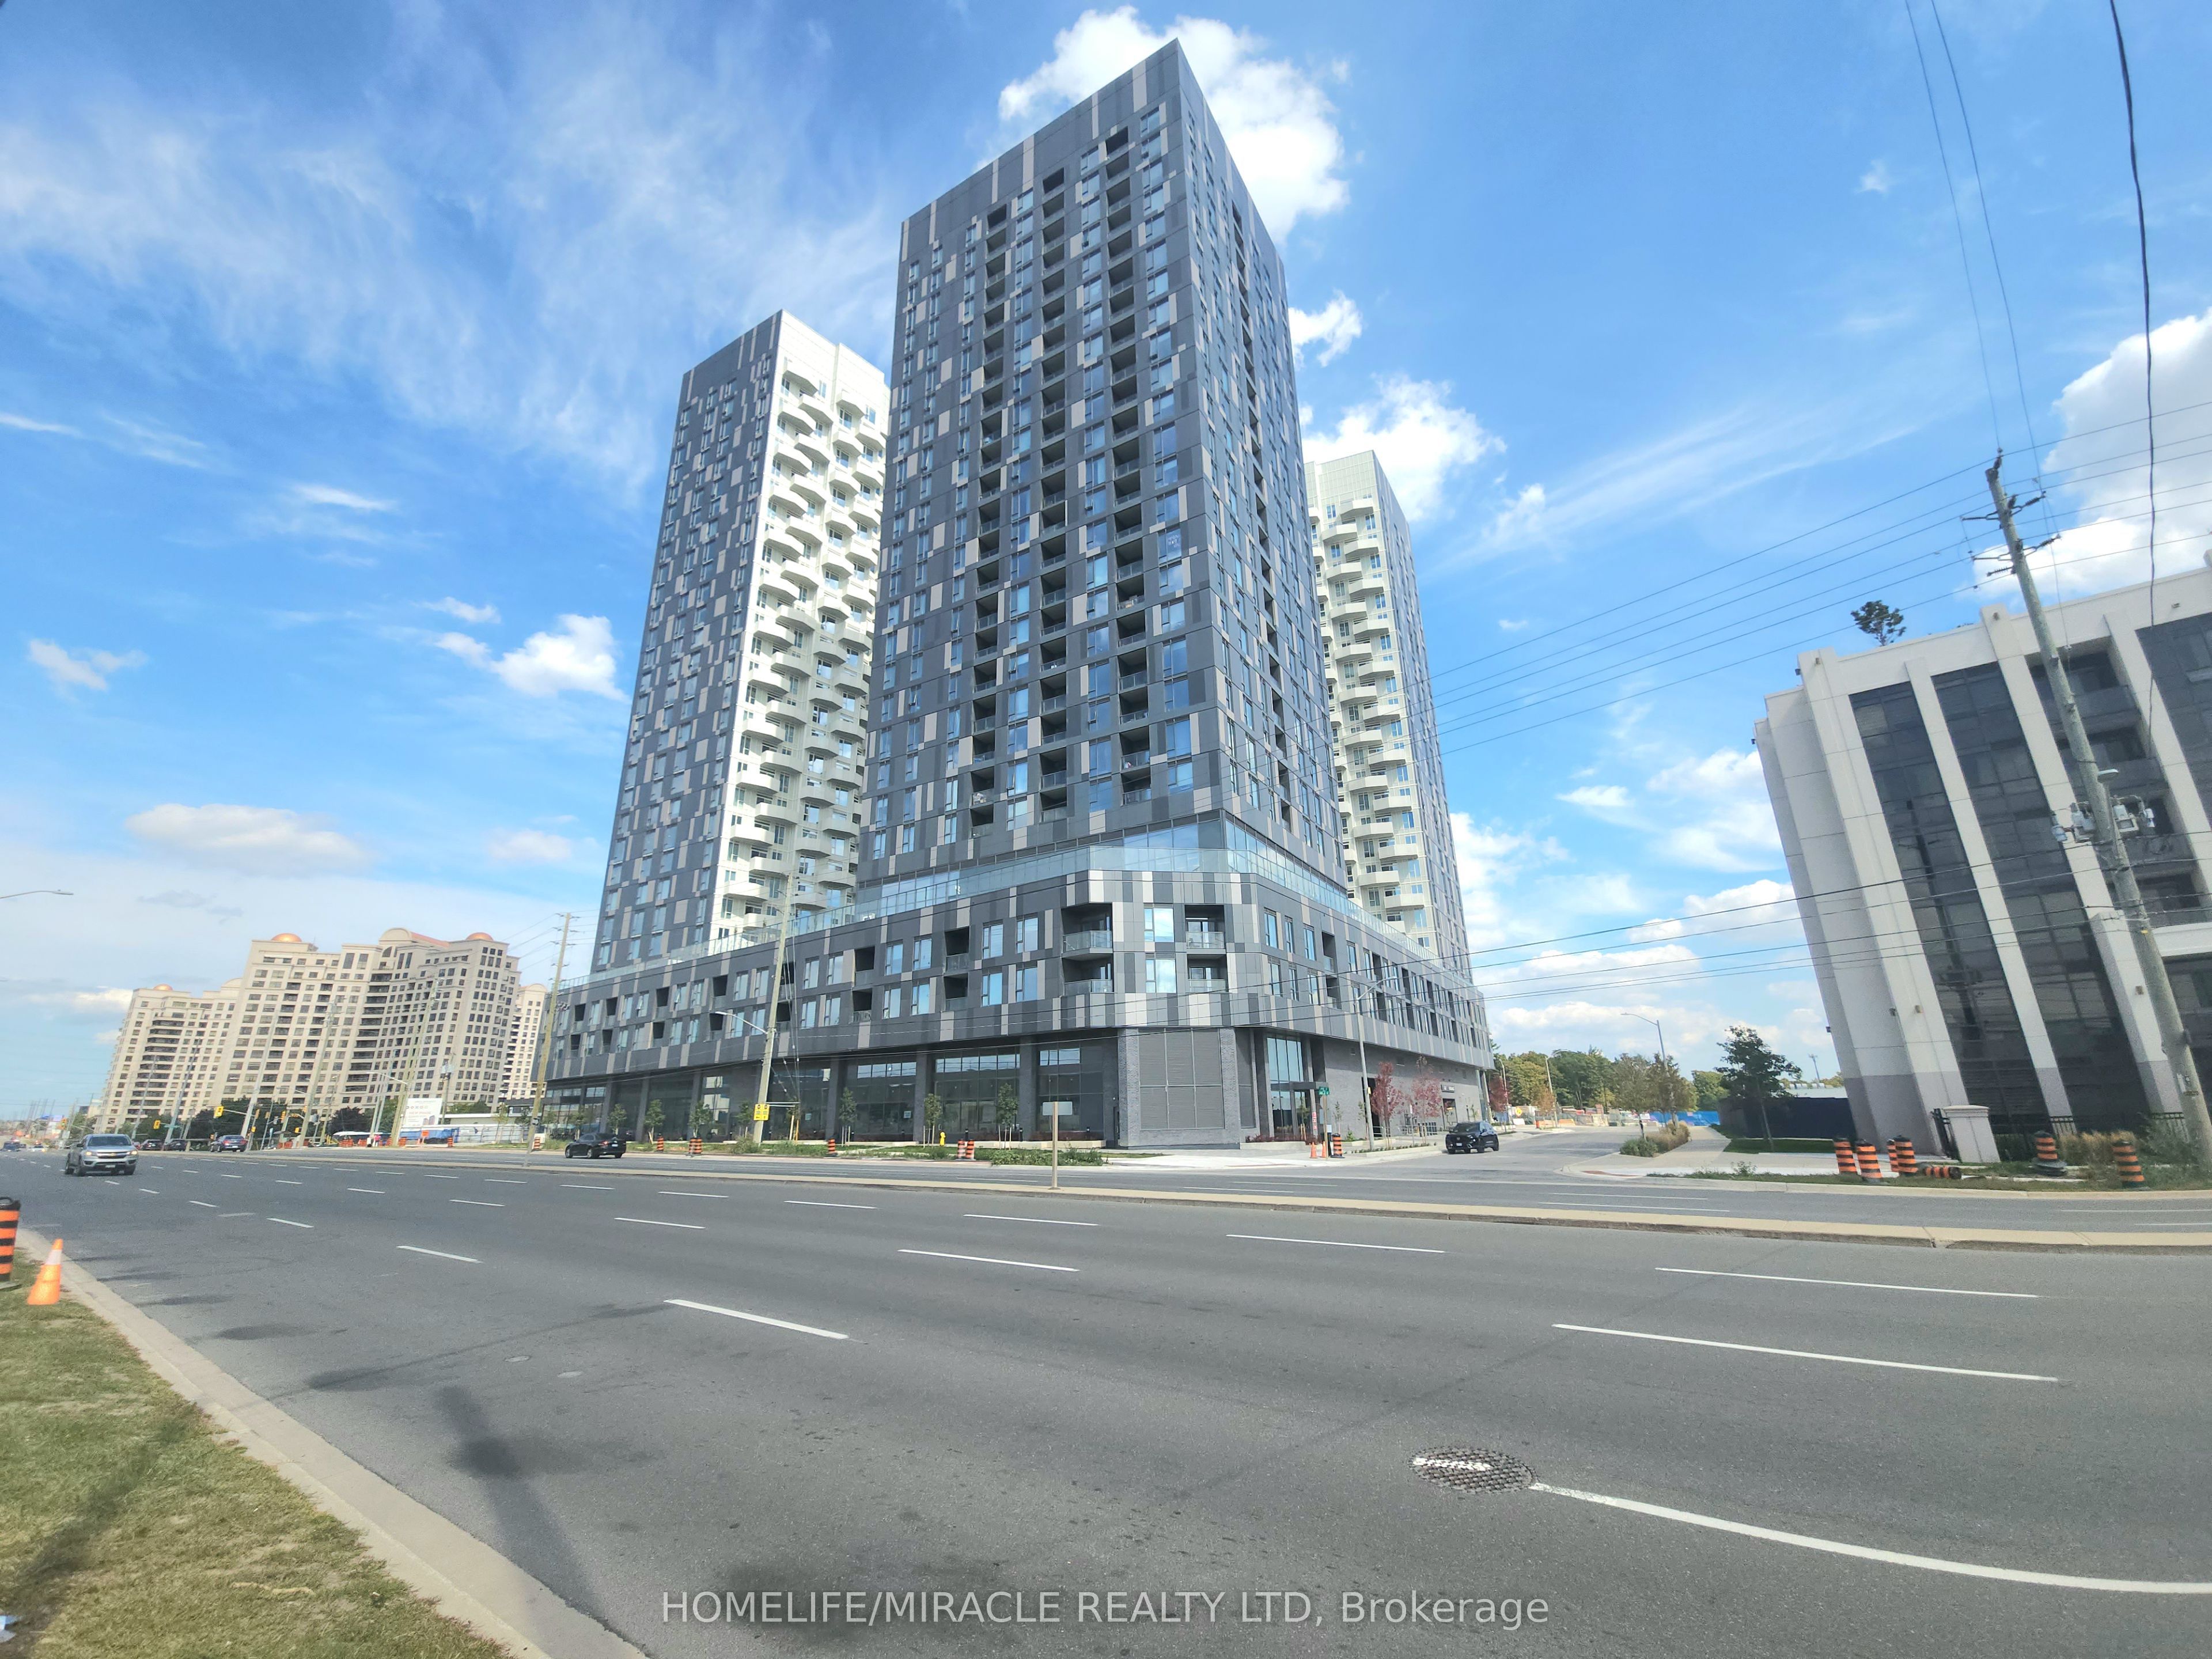
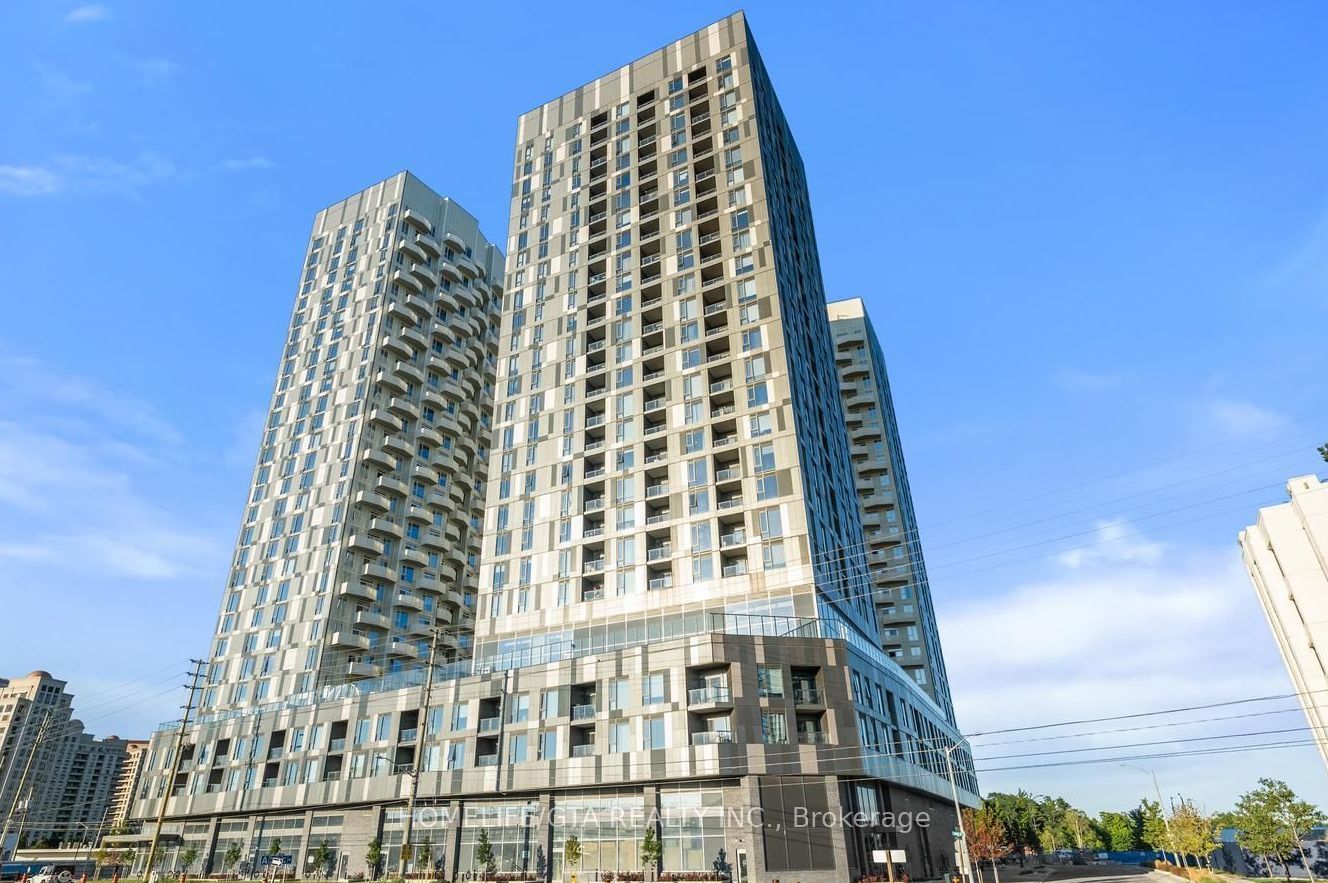
10 Abeja Street 819, Vaughan, ON L4K 0R4 #819
Concord, Vaughan
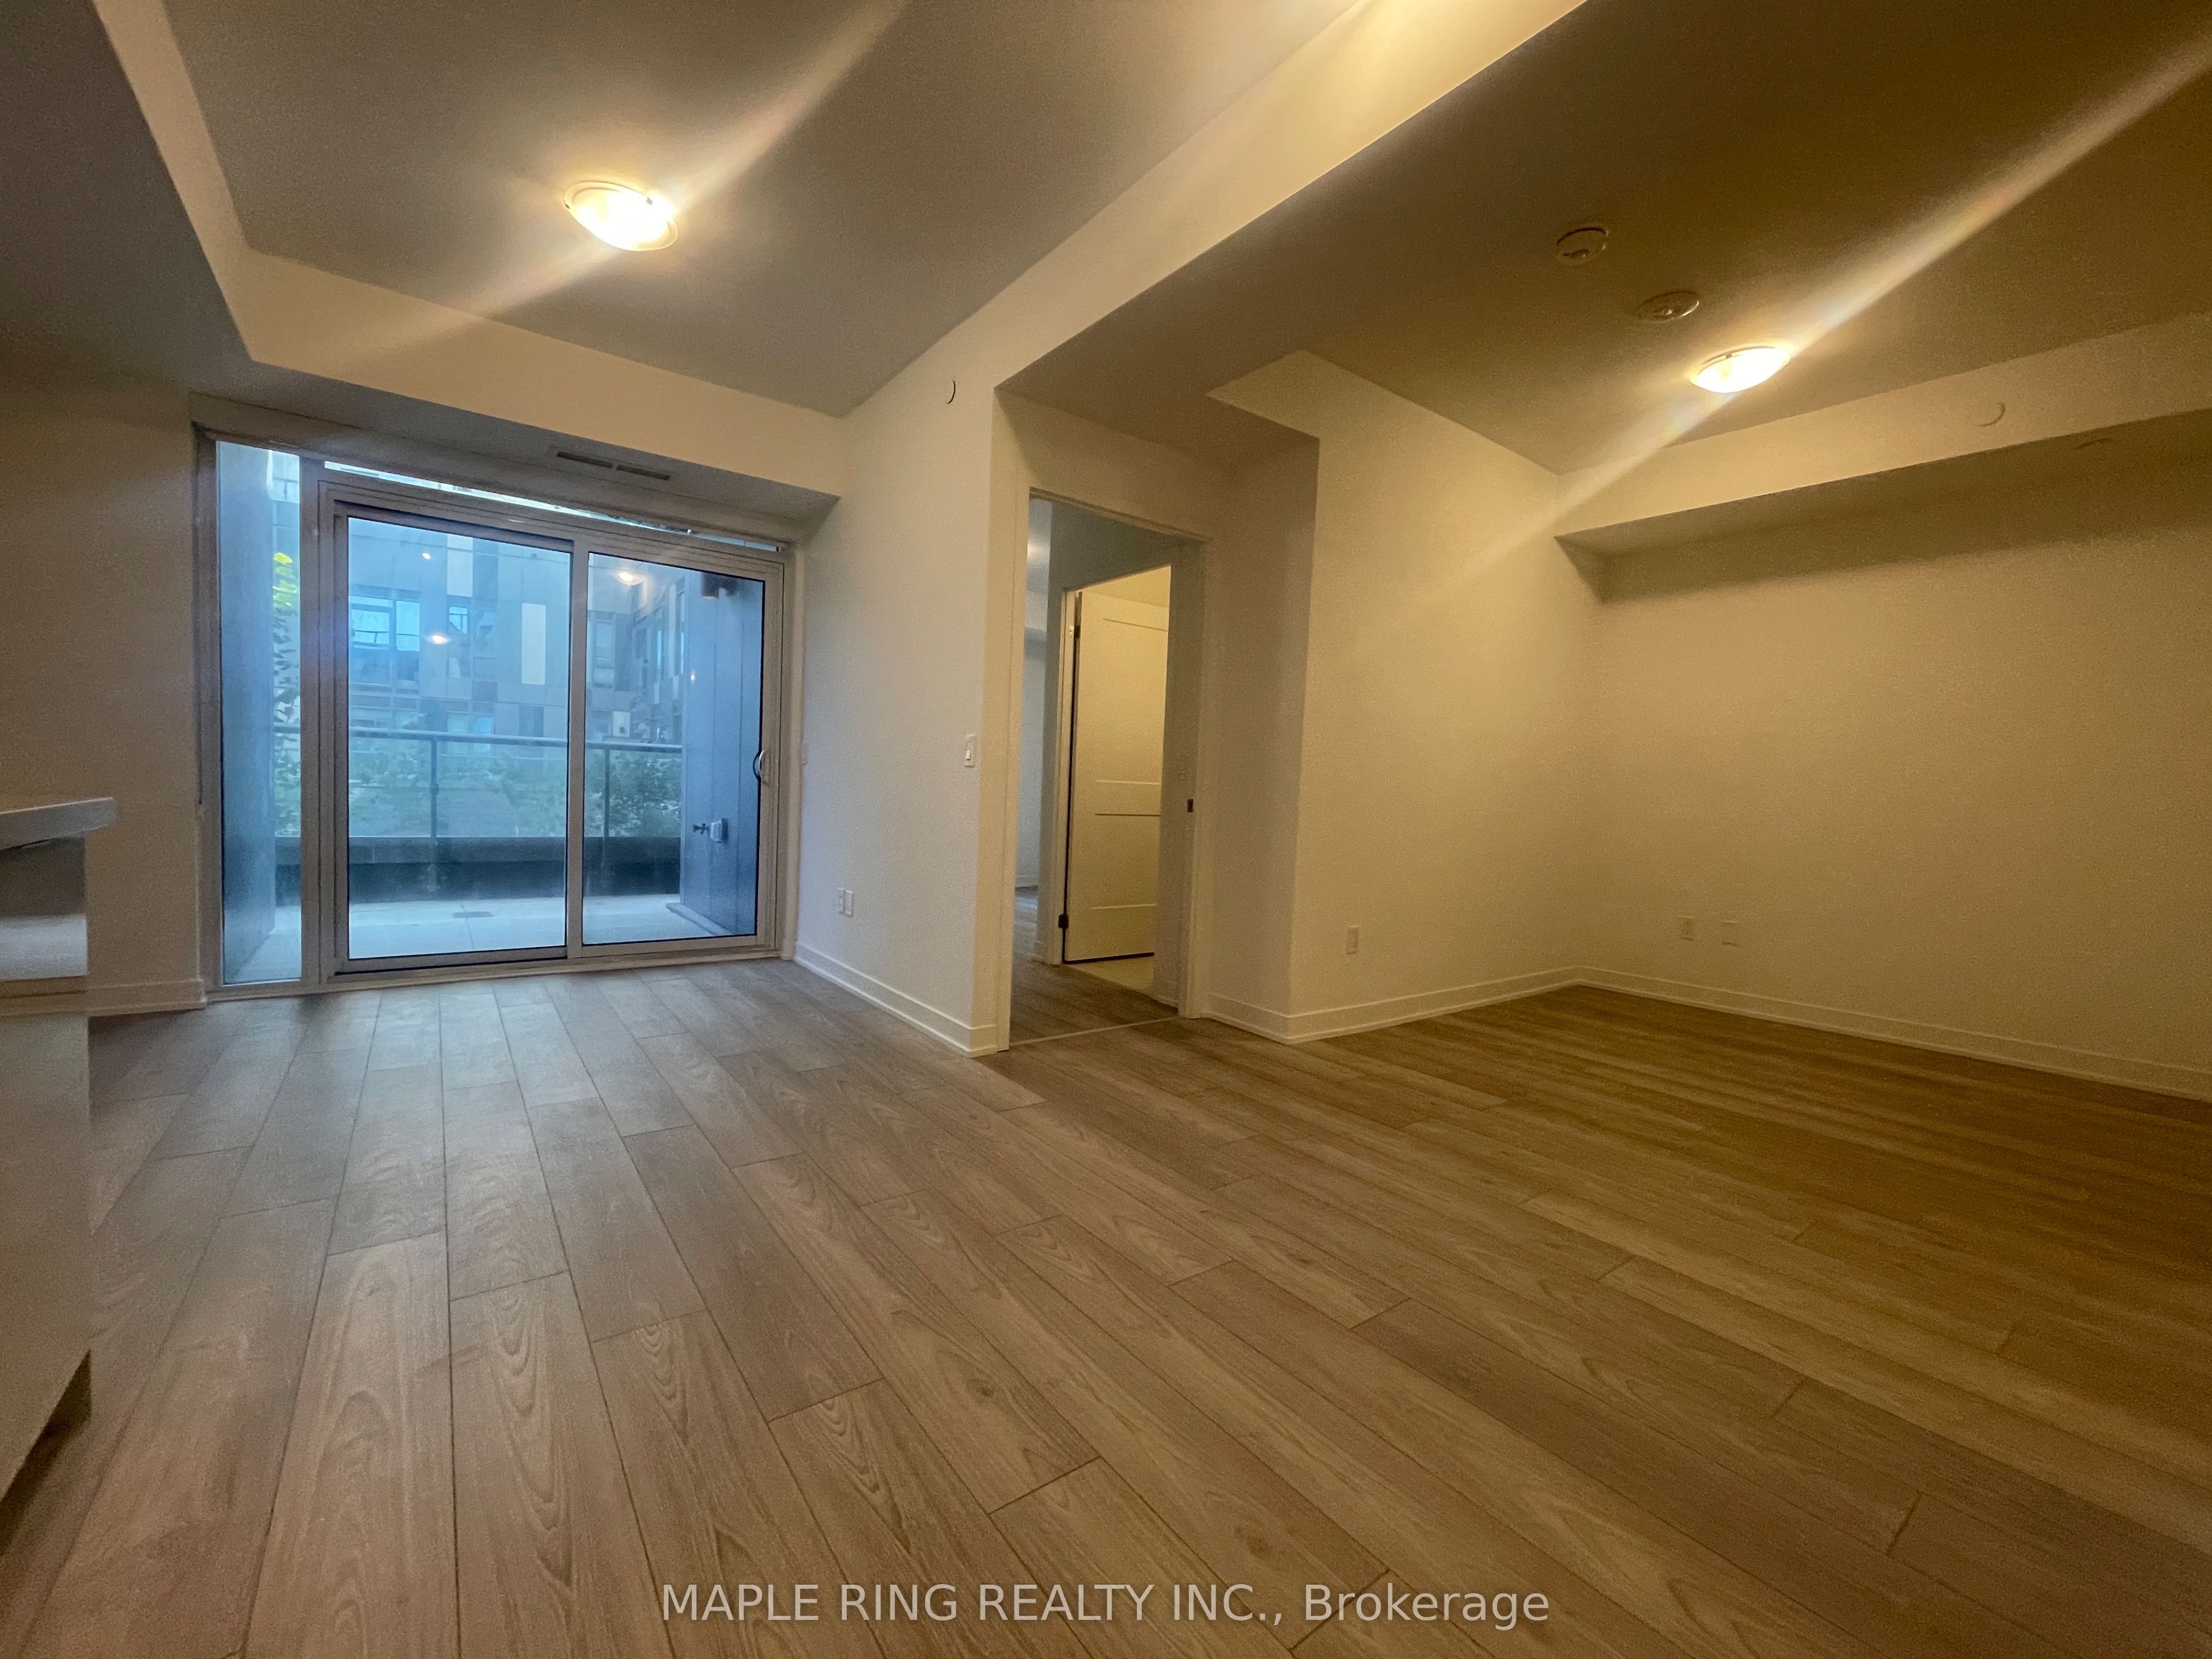
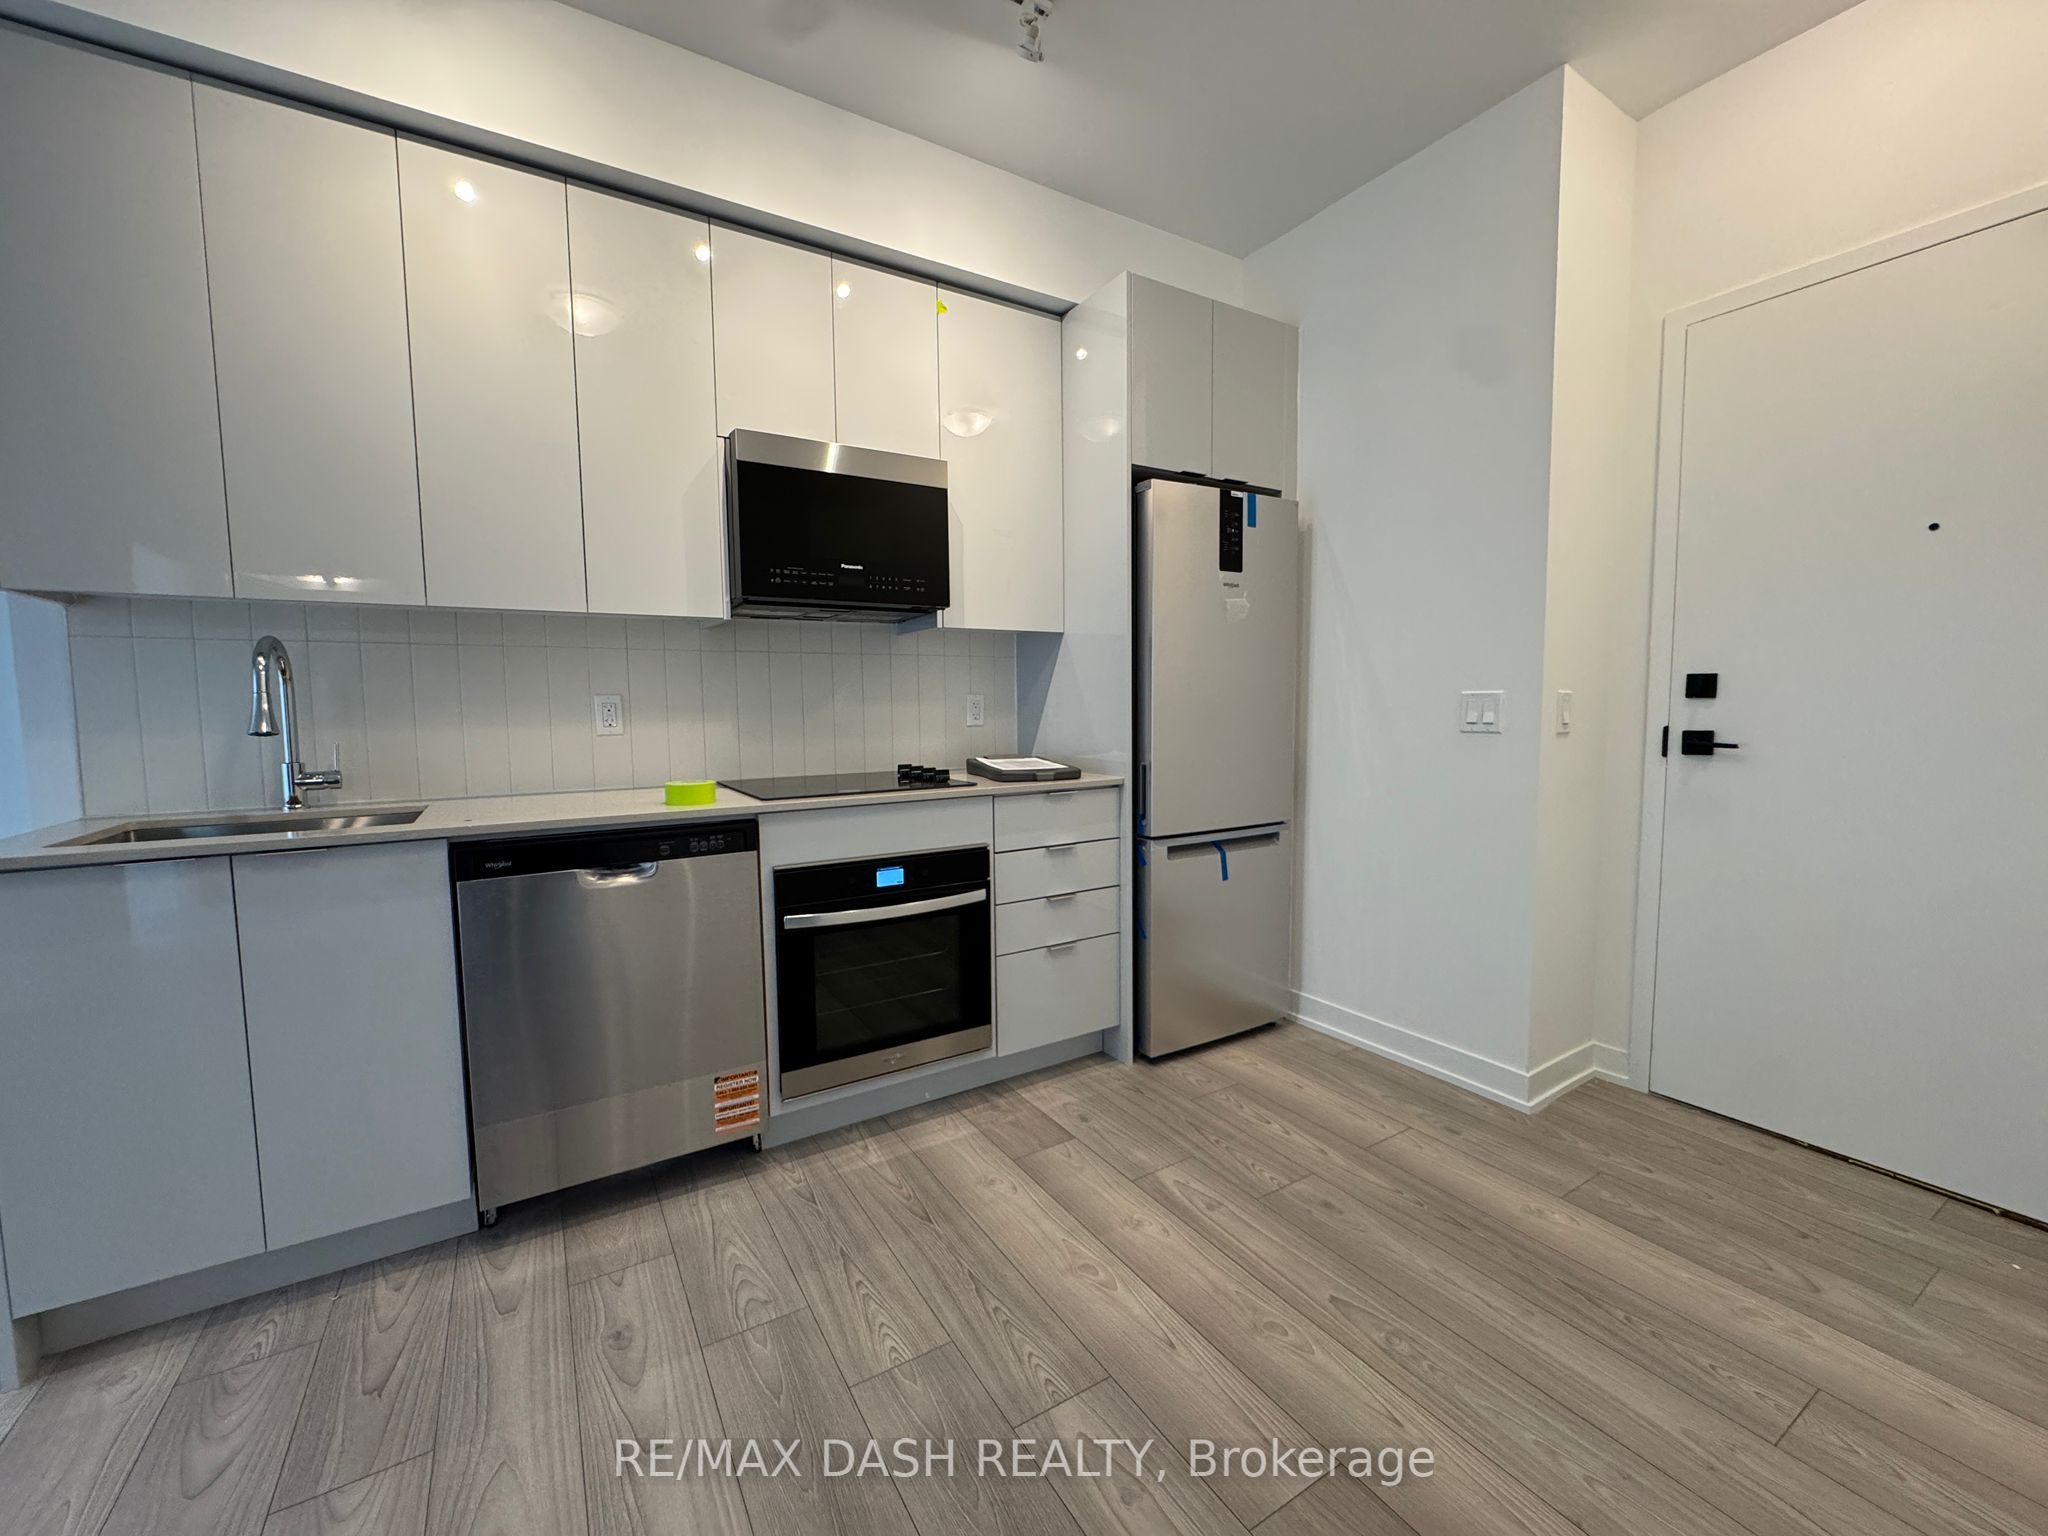
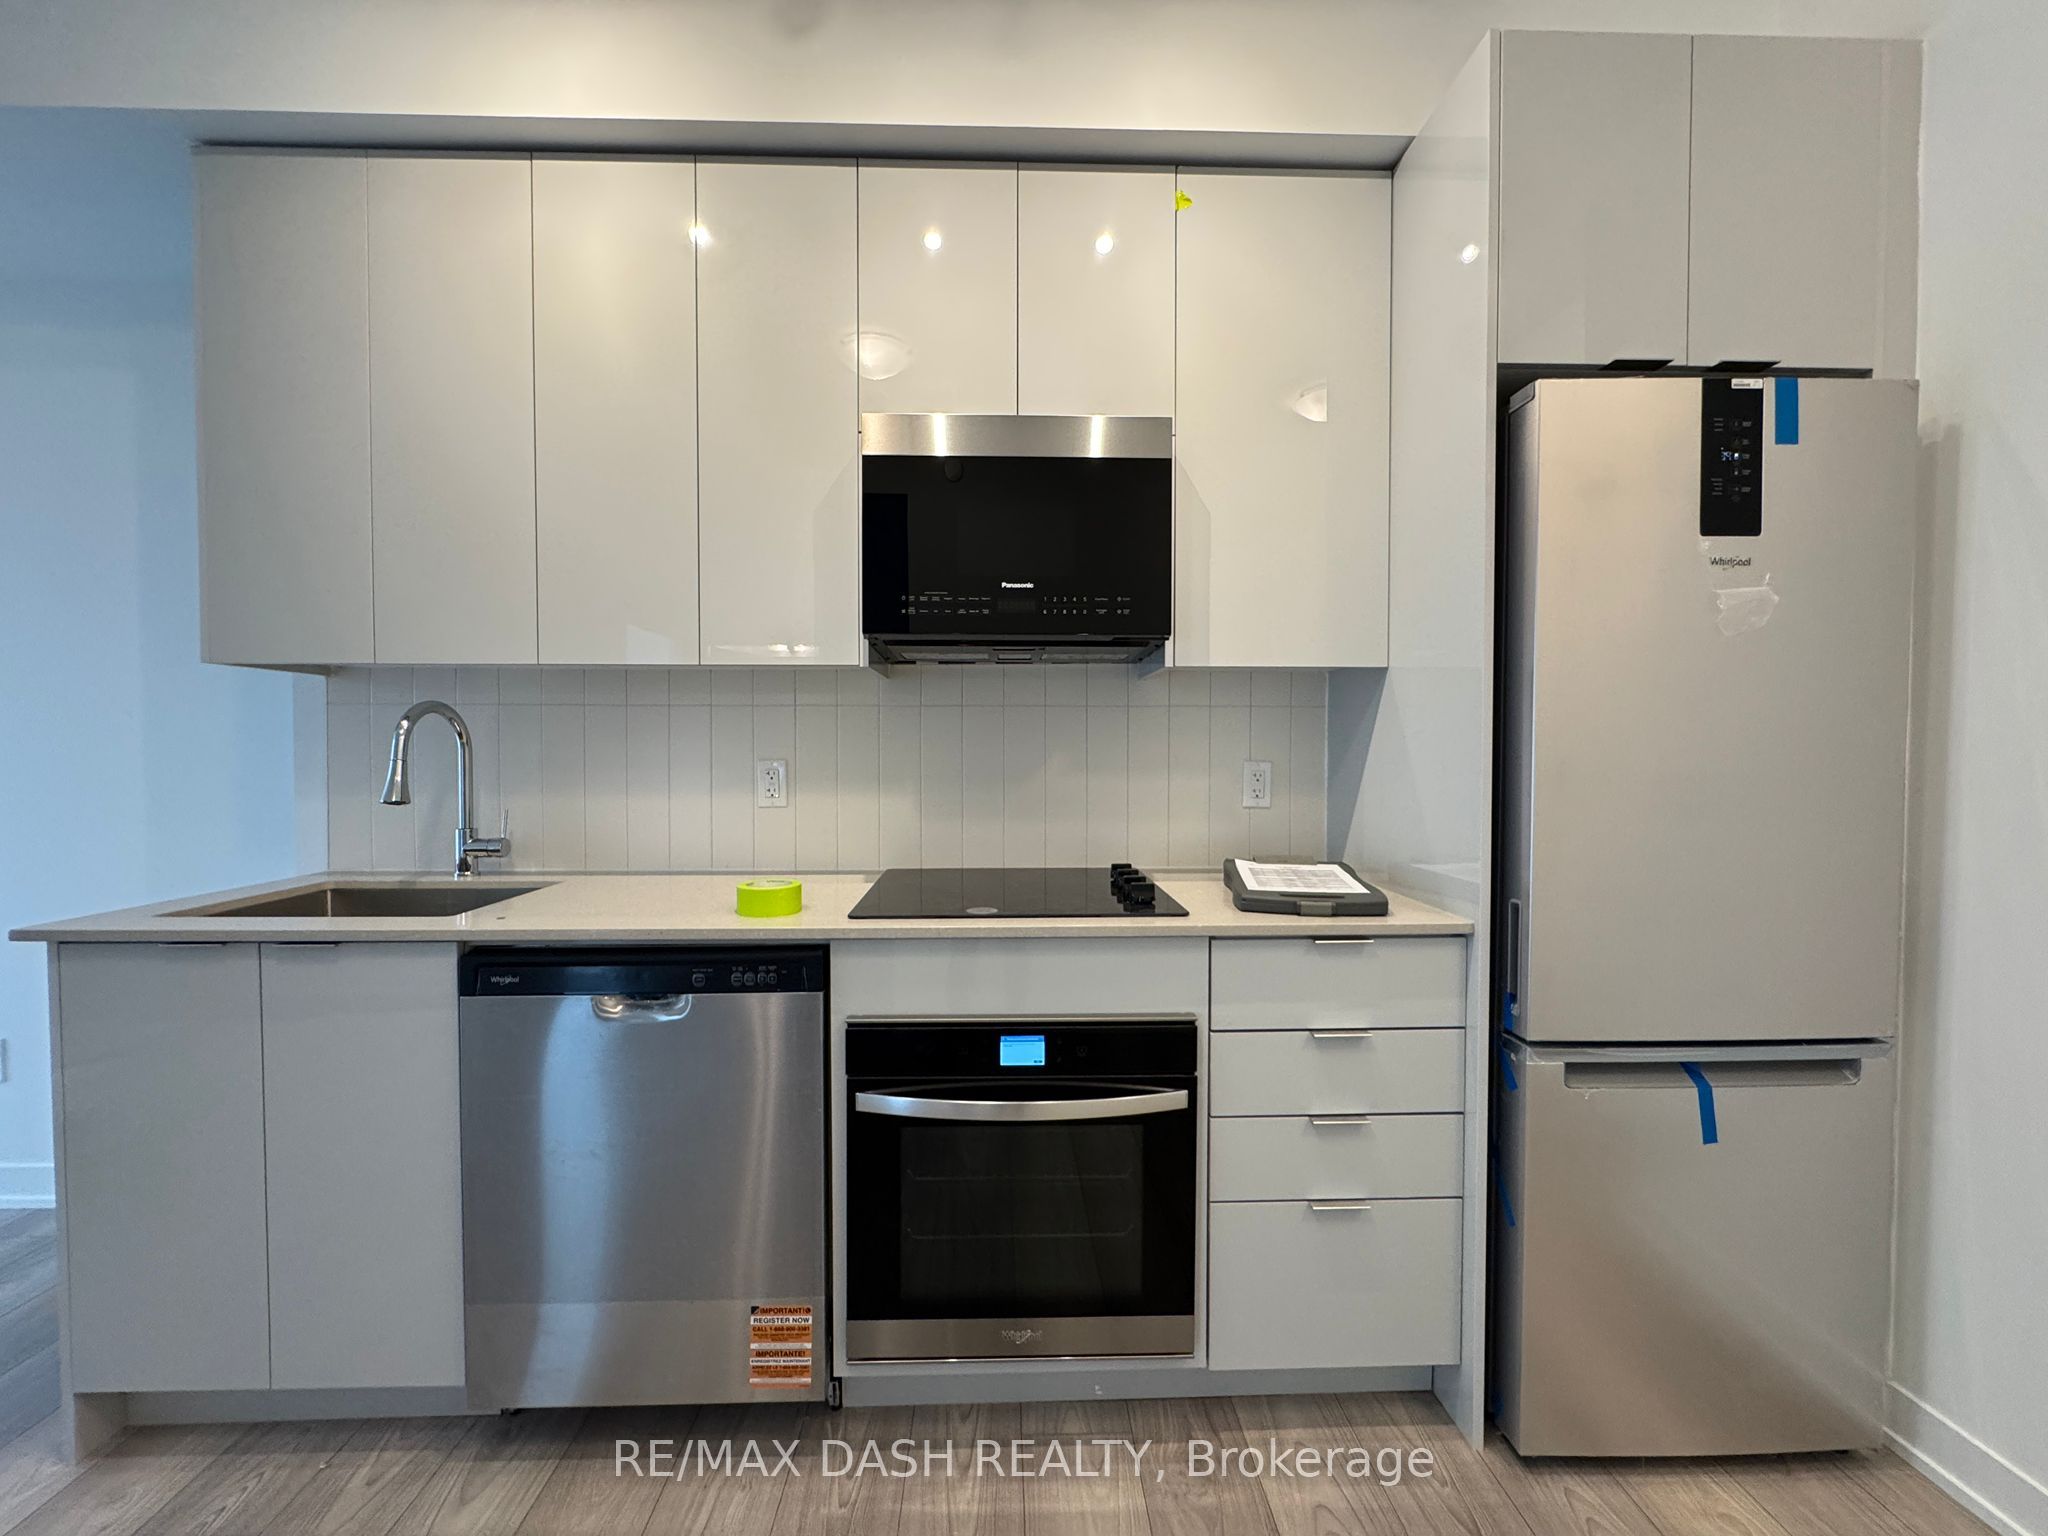
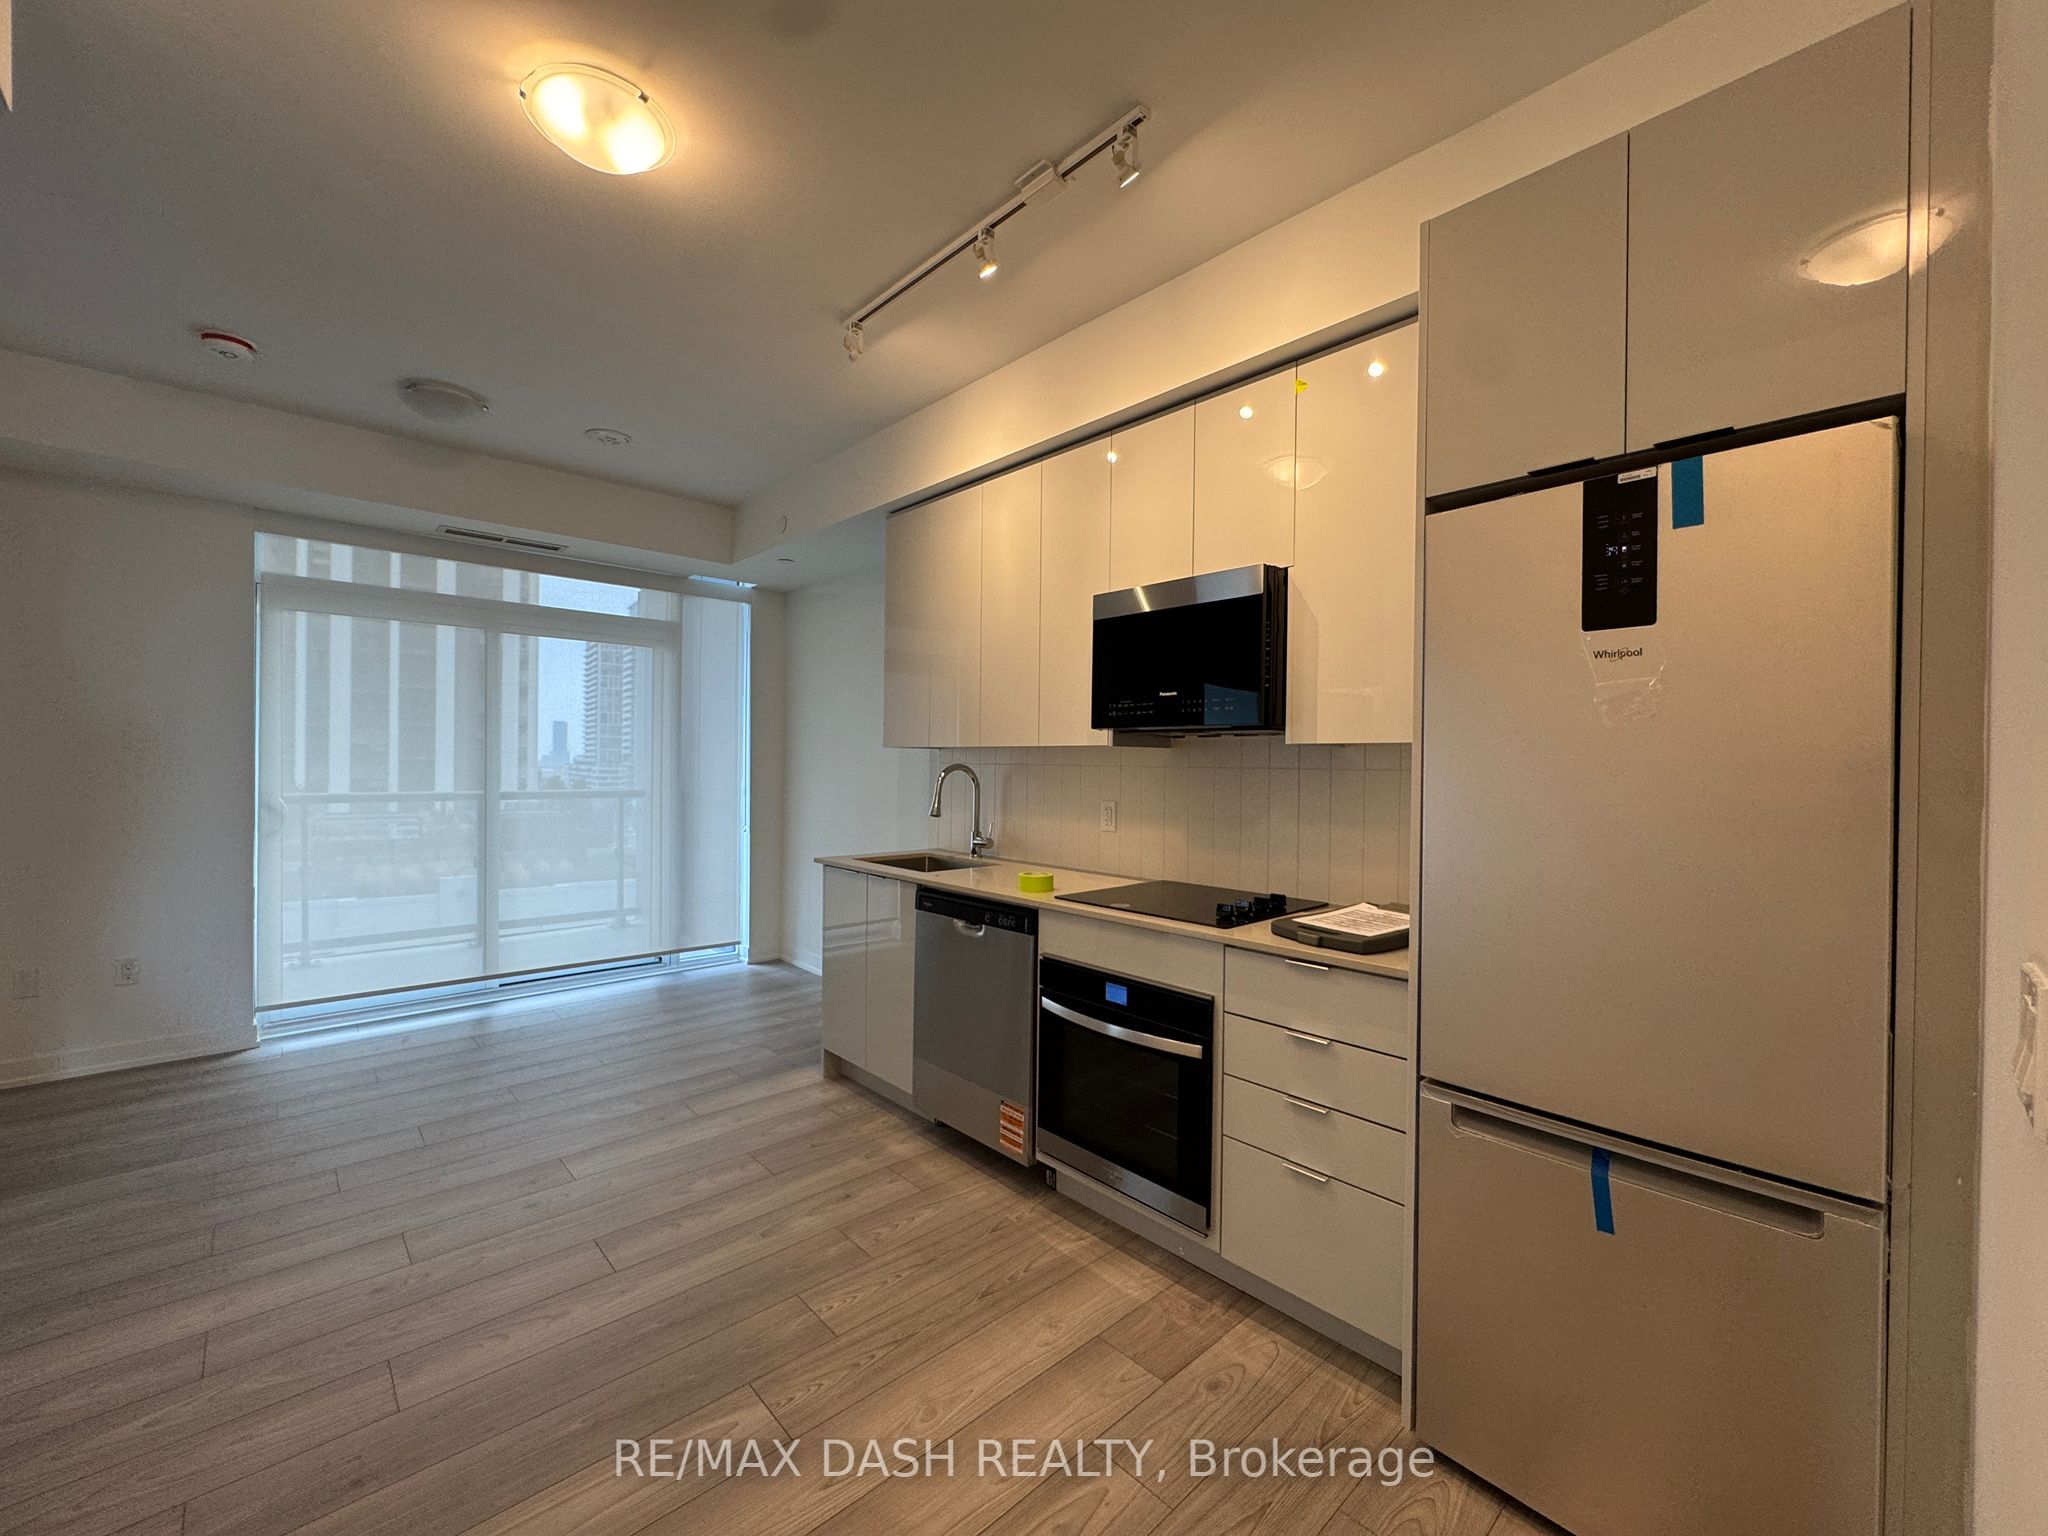
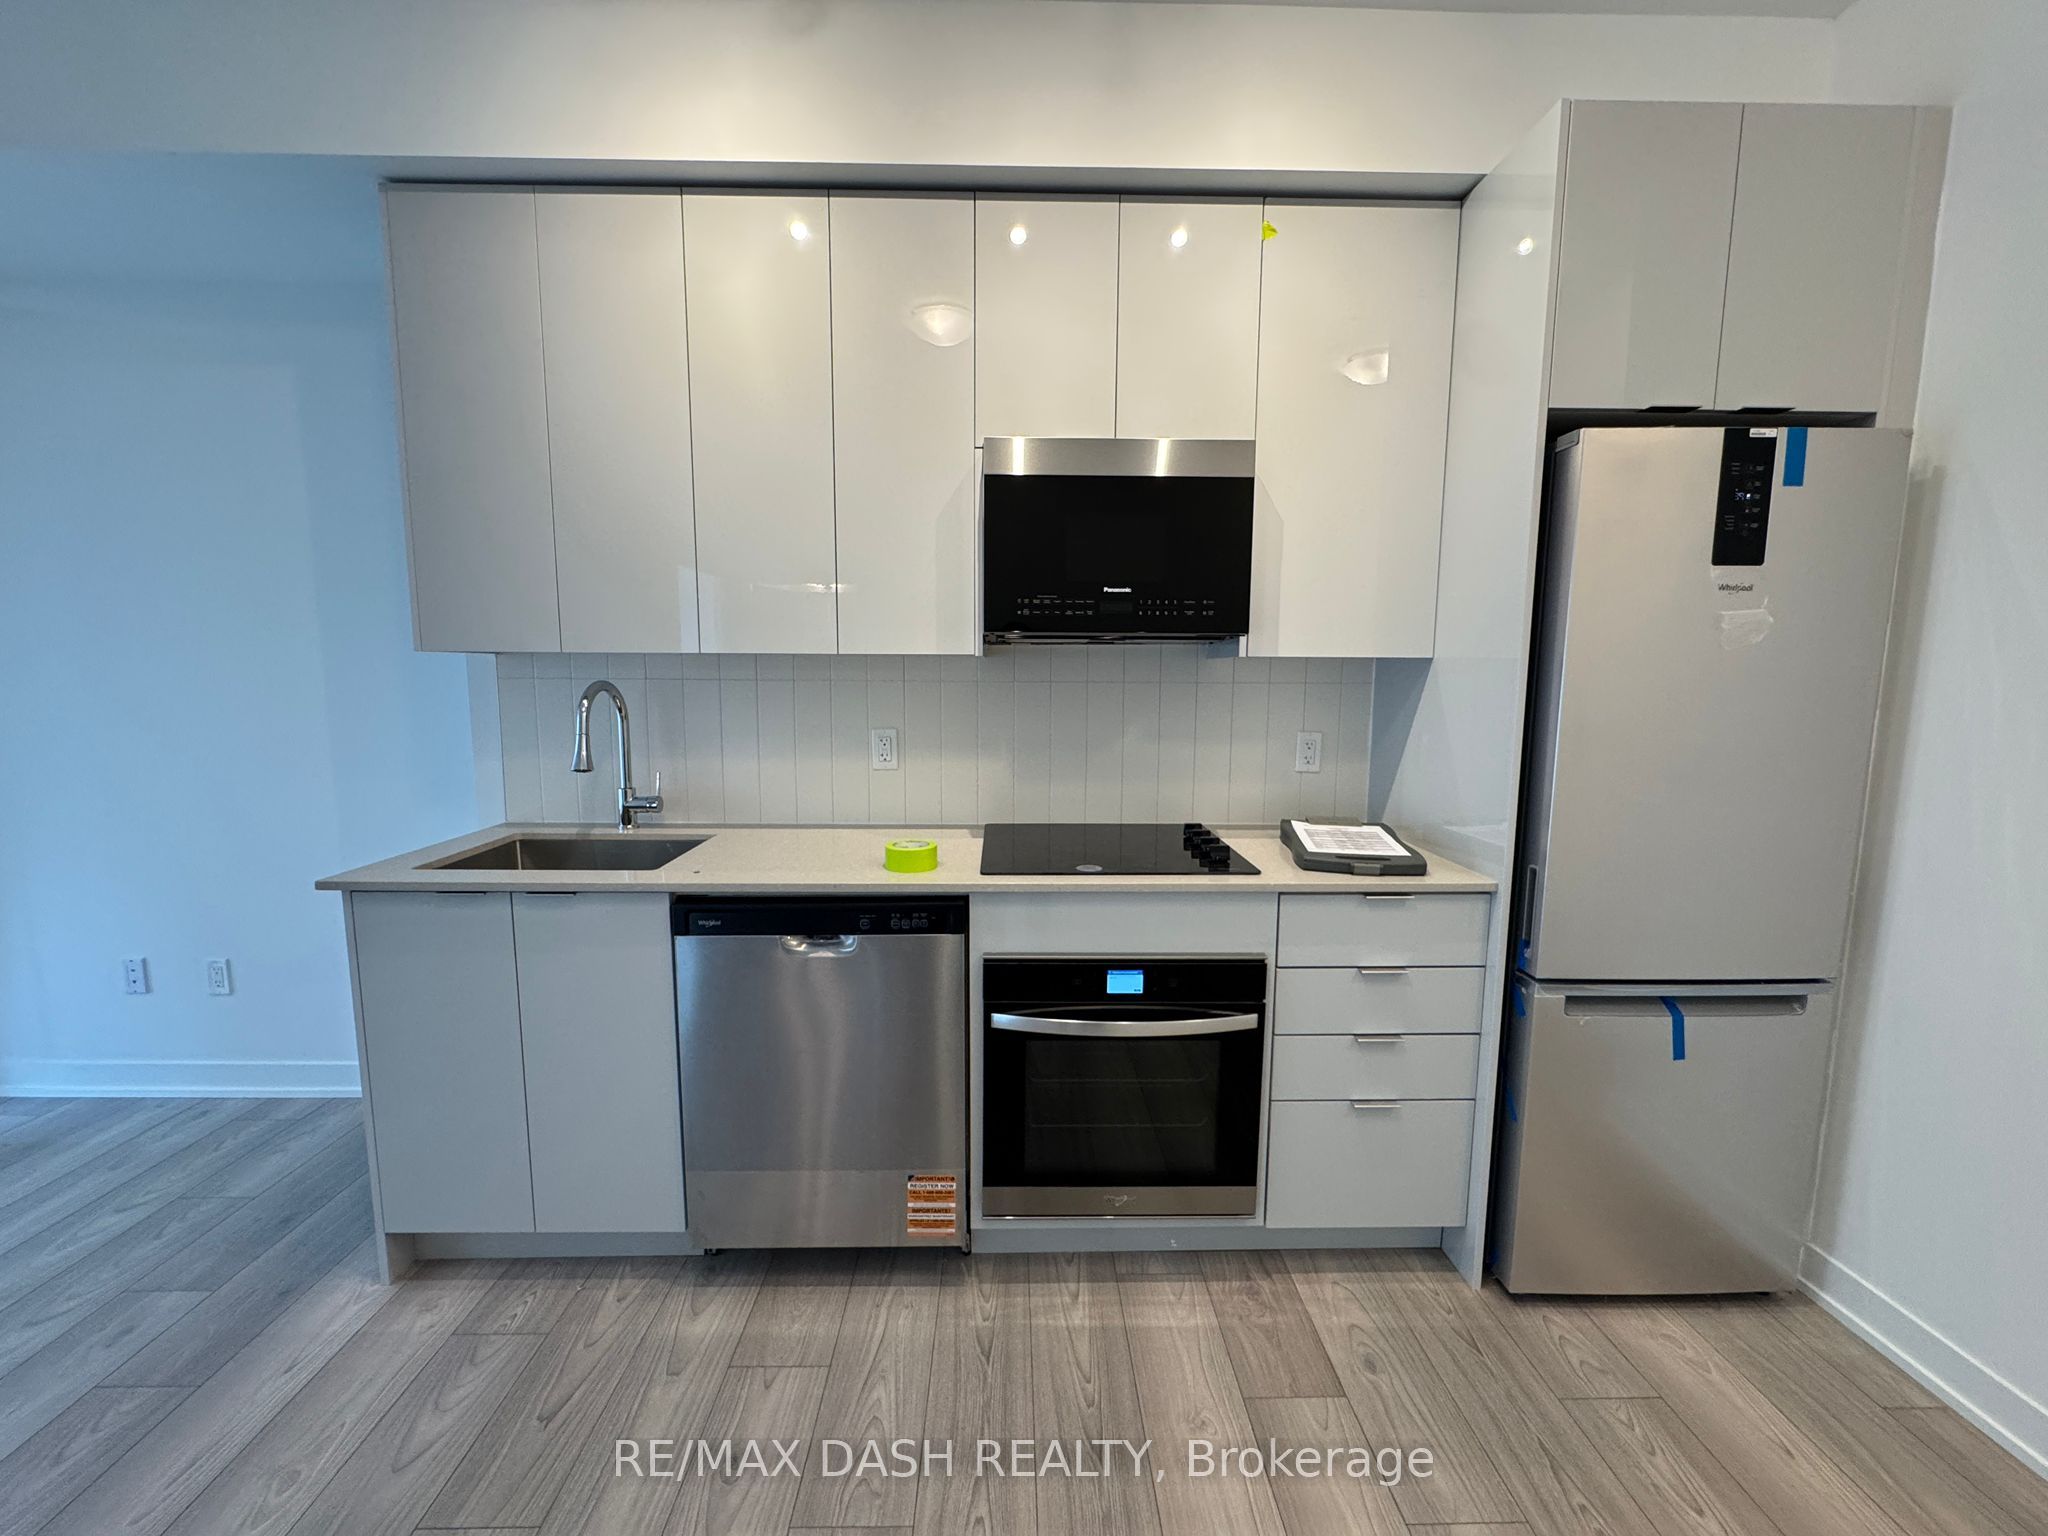
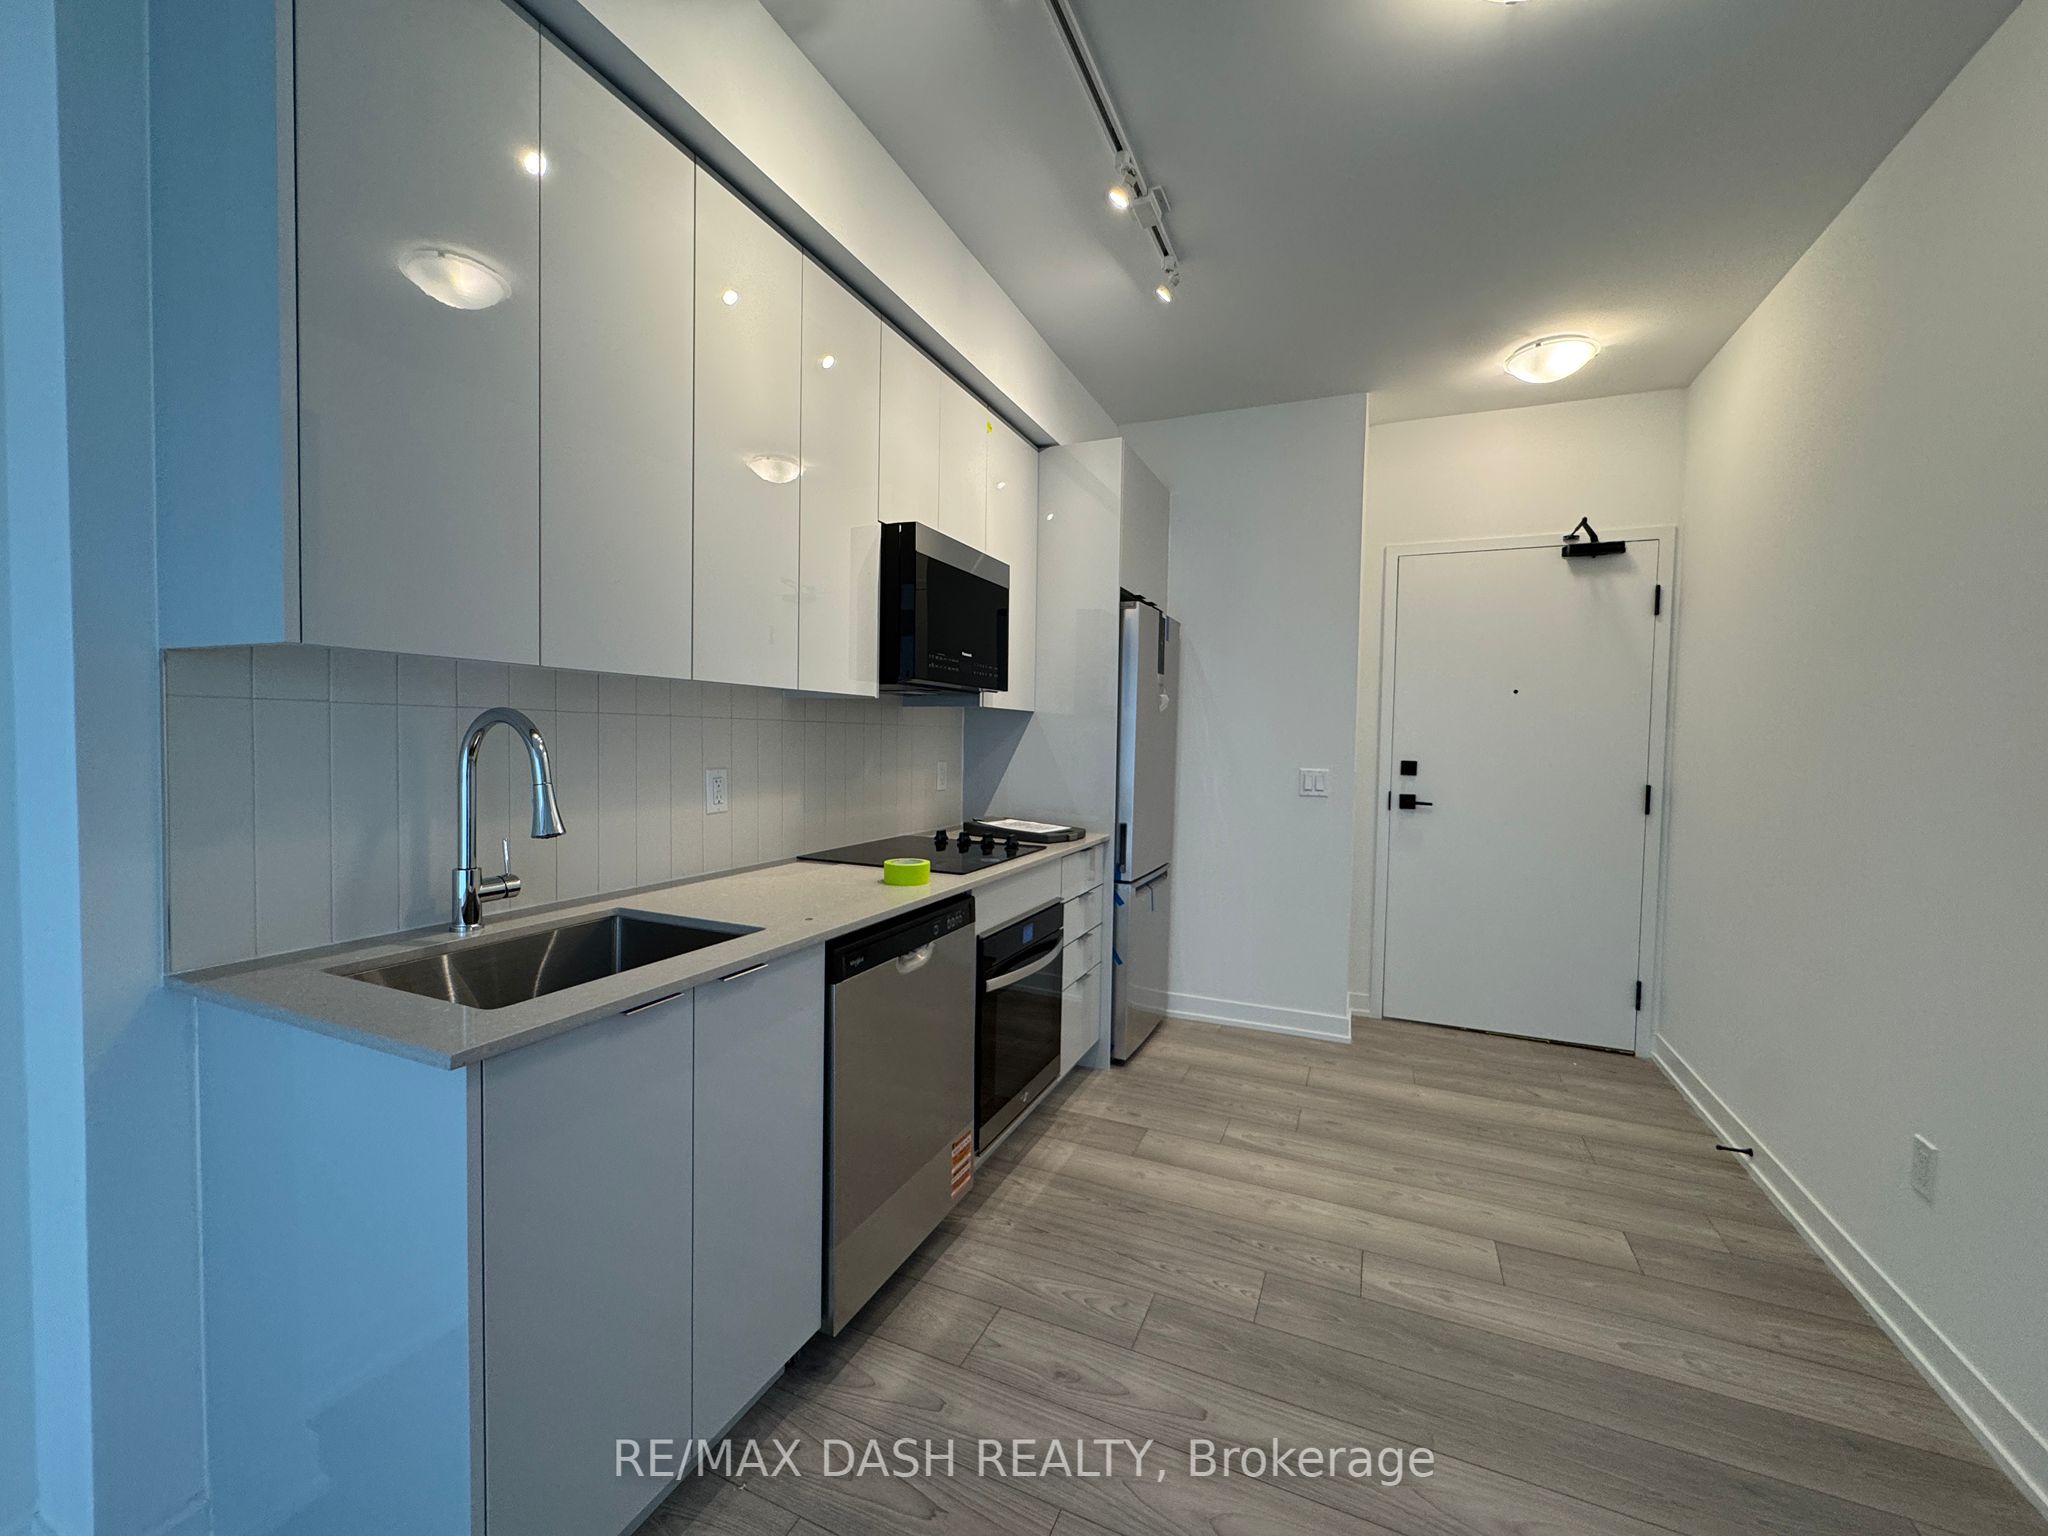
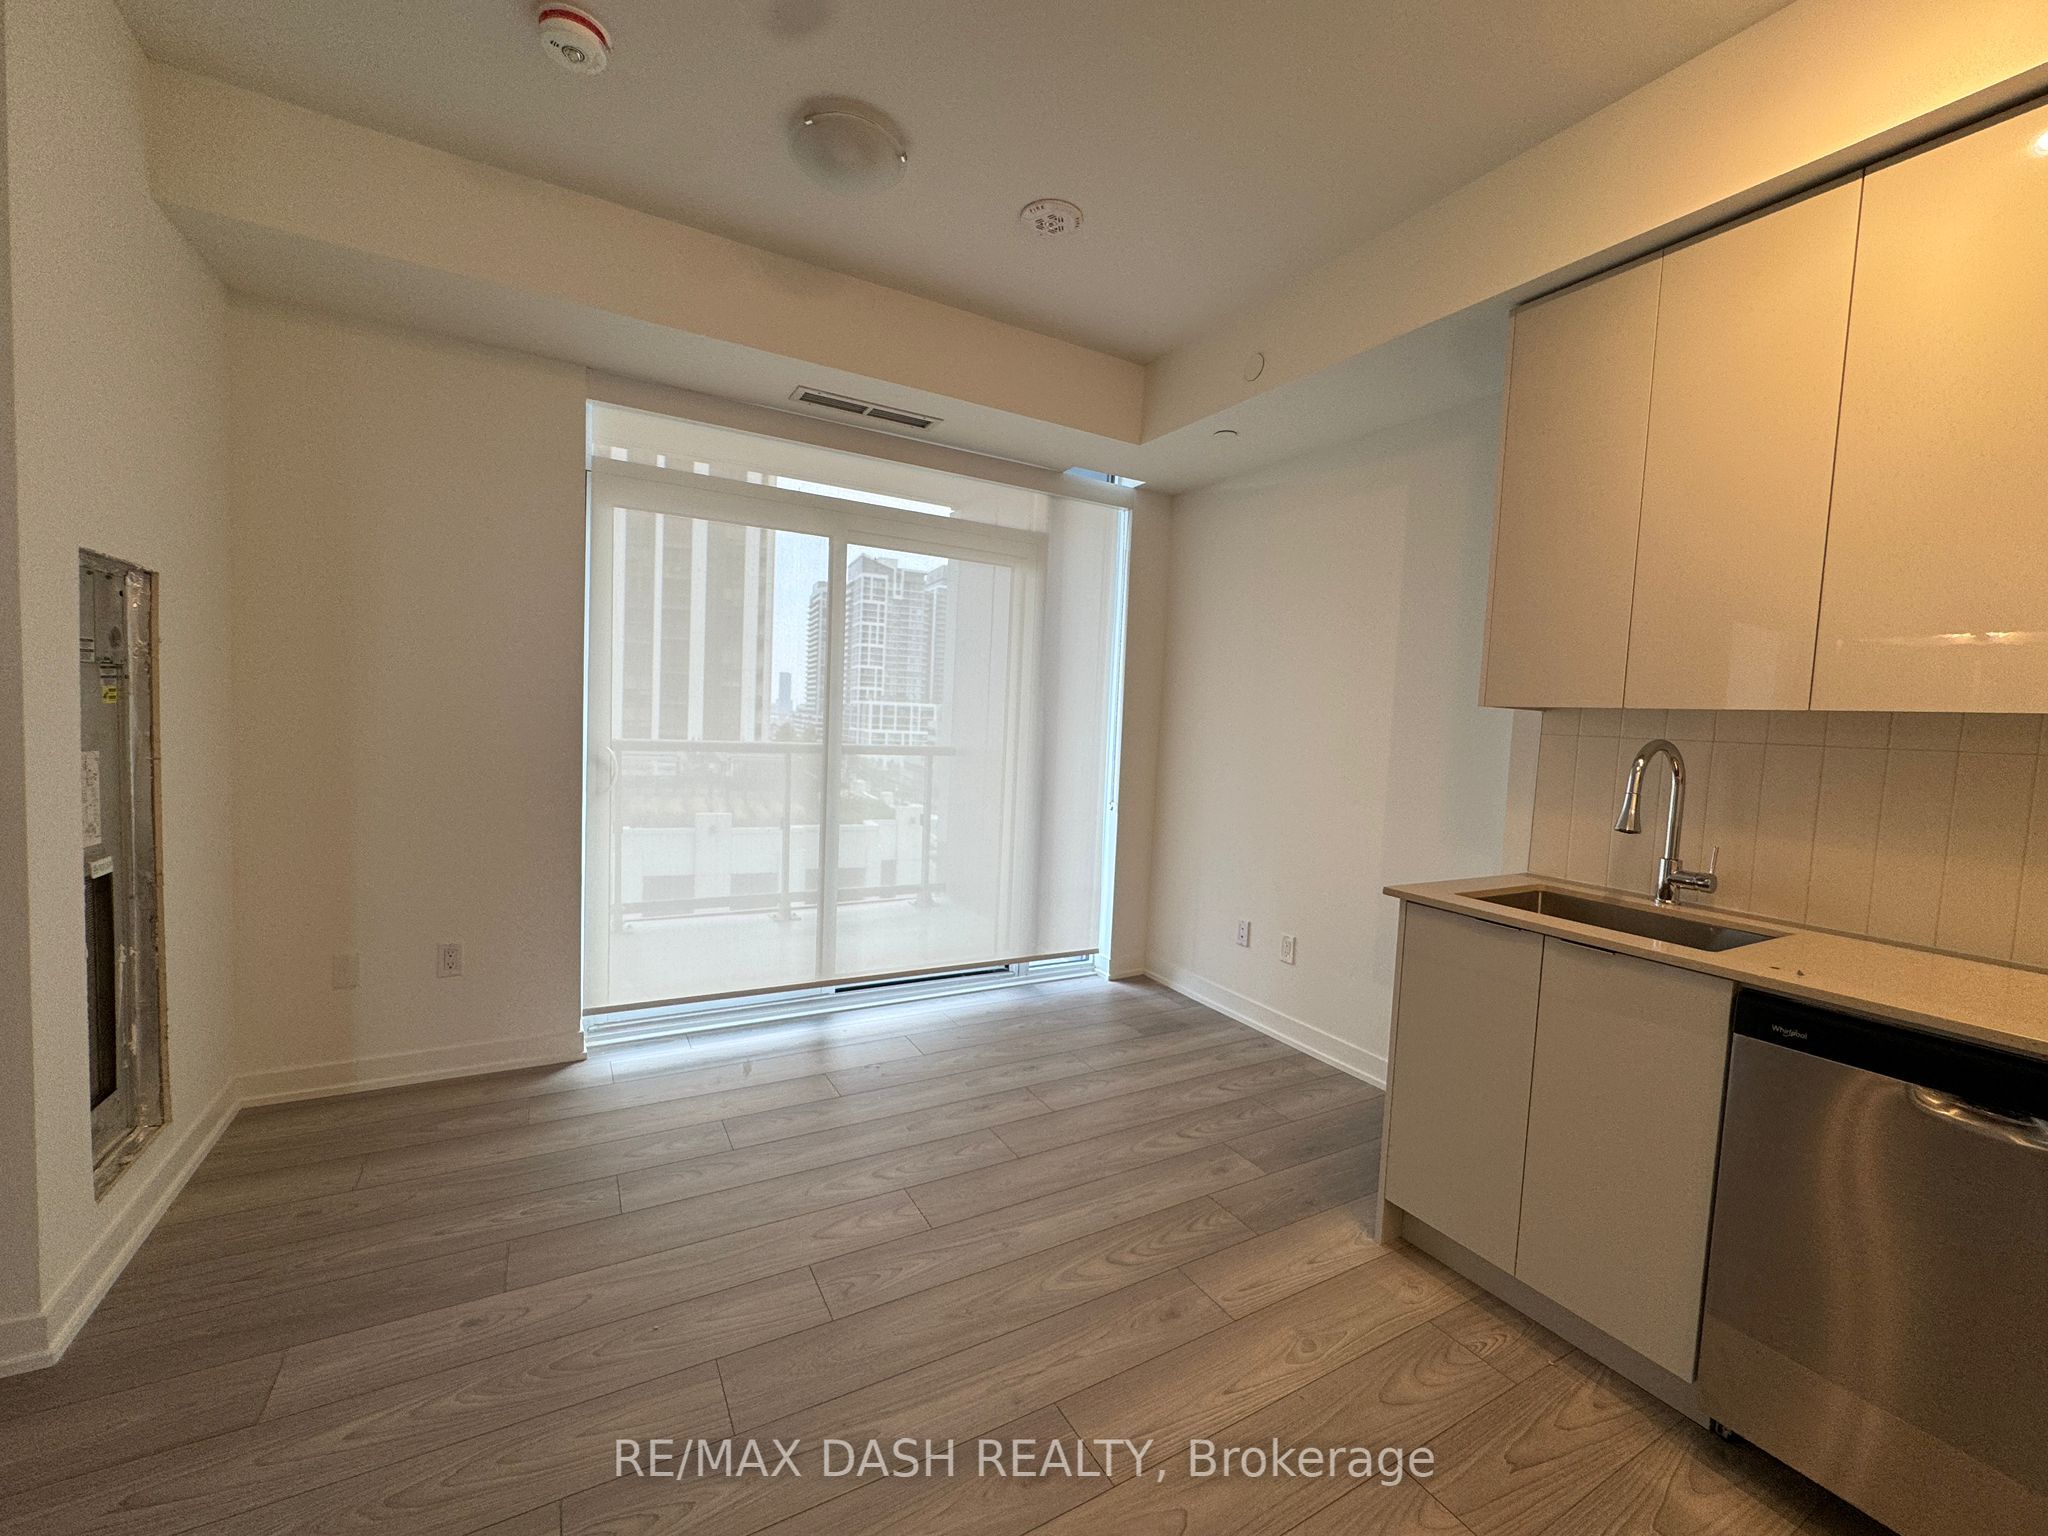
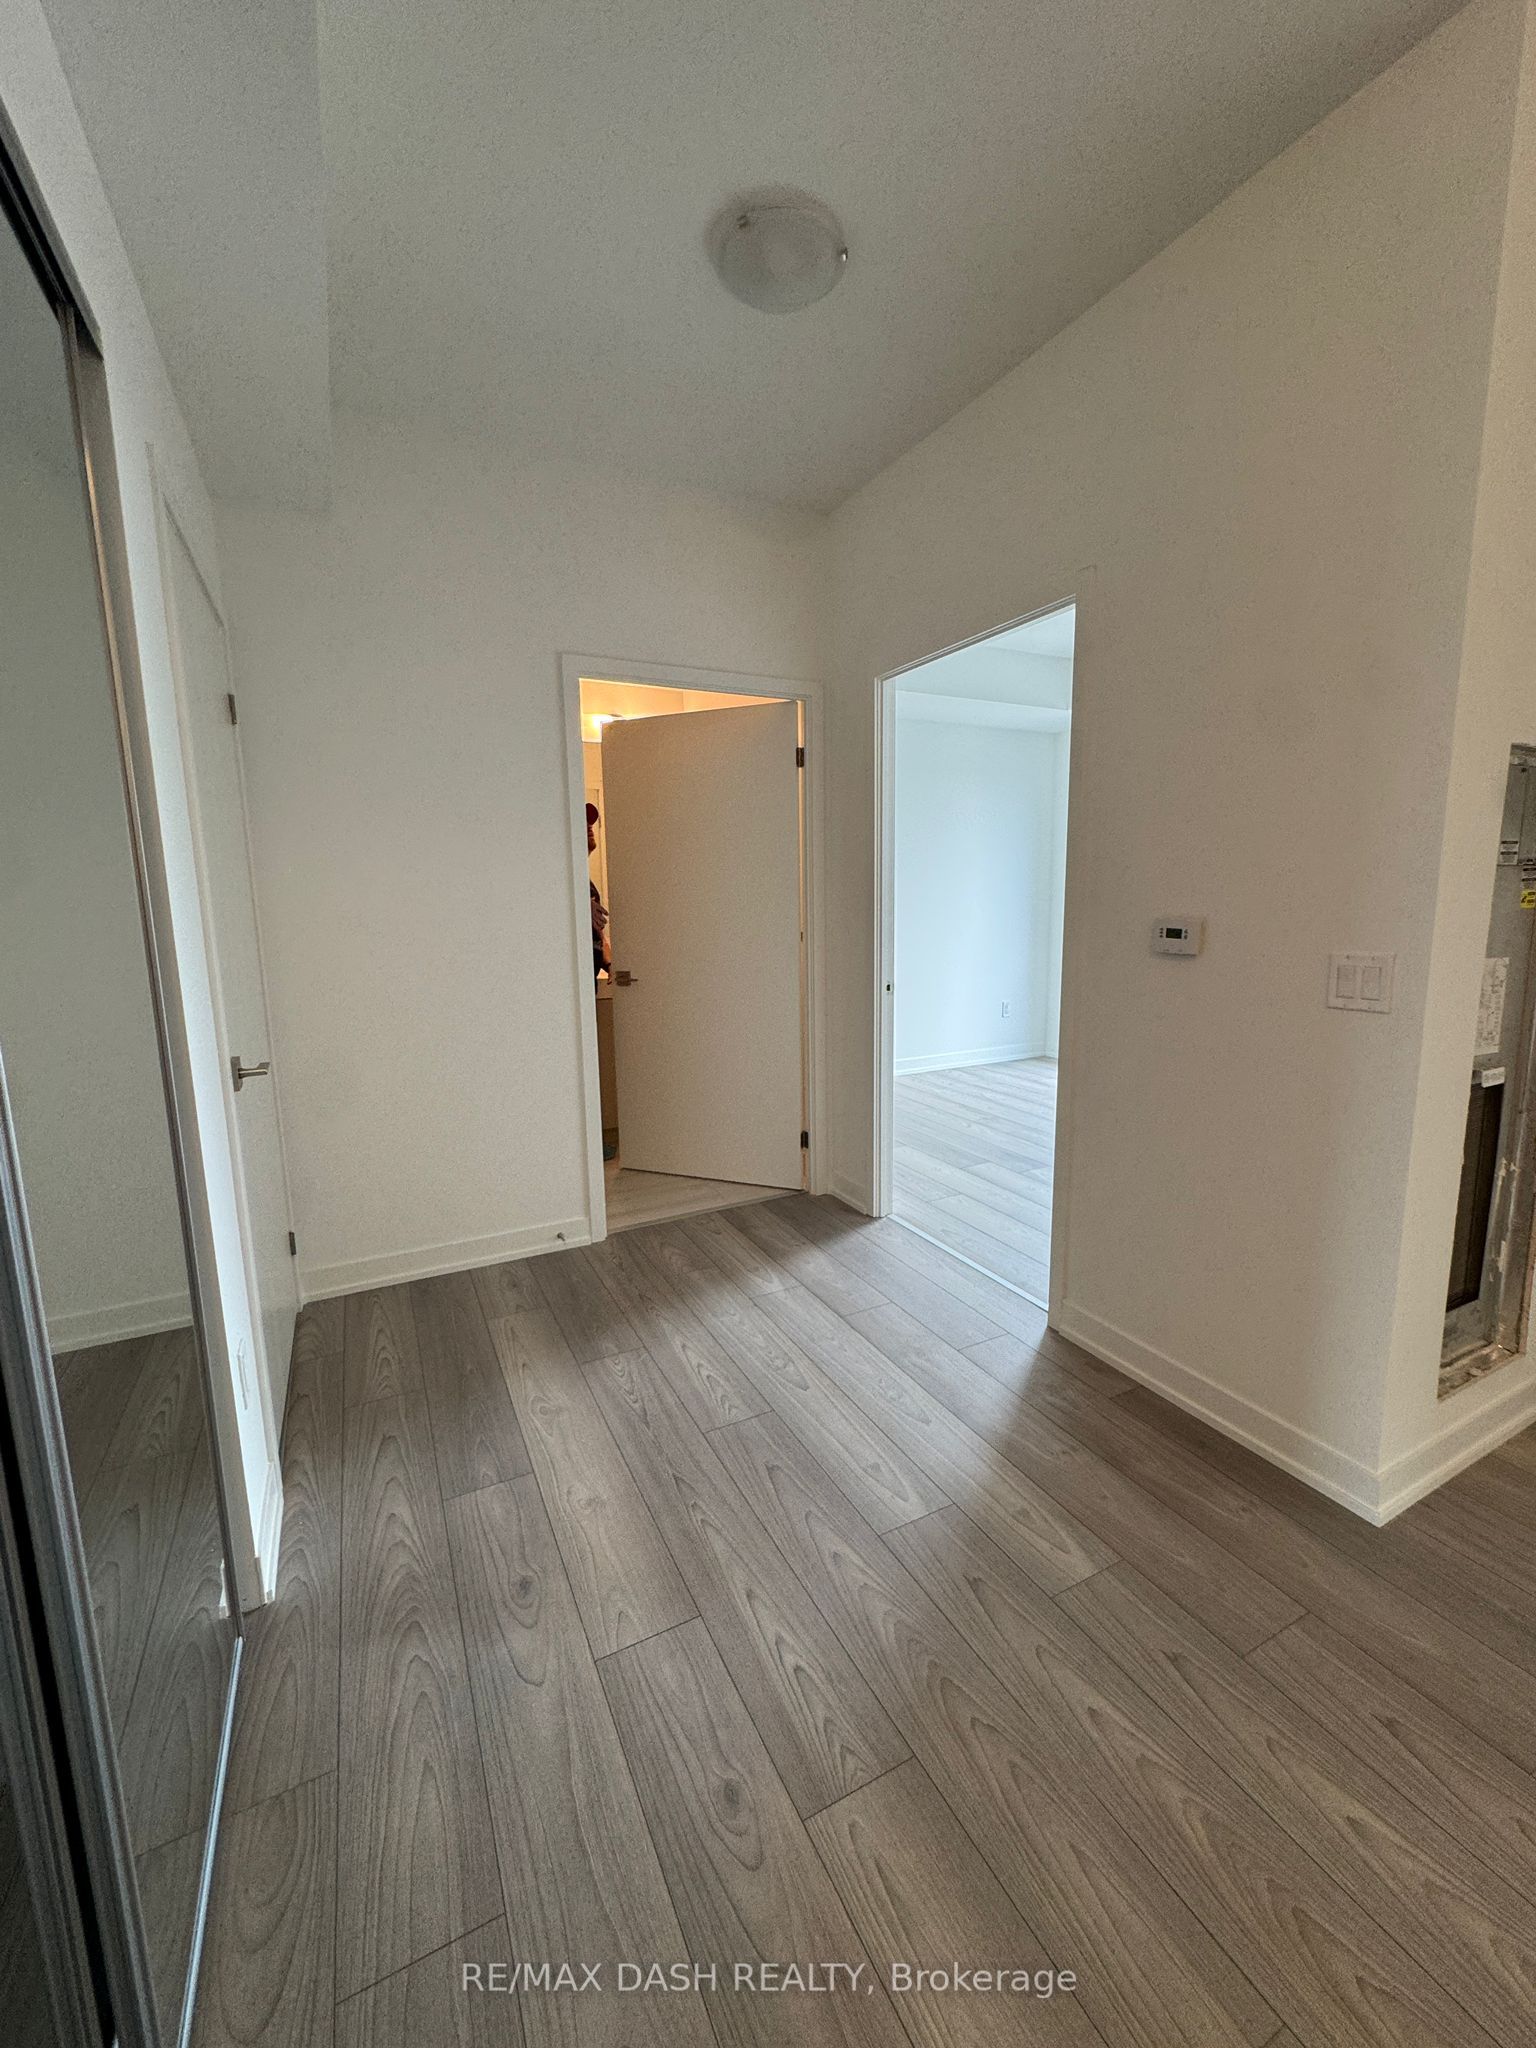
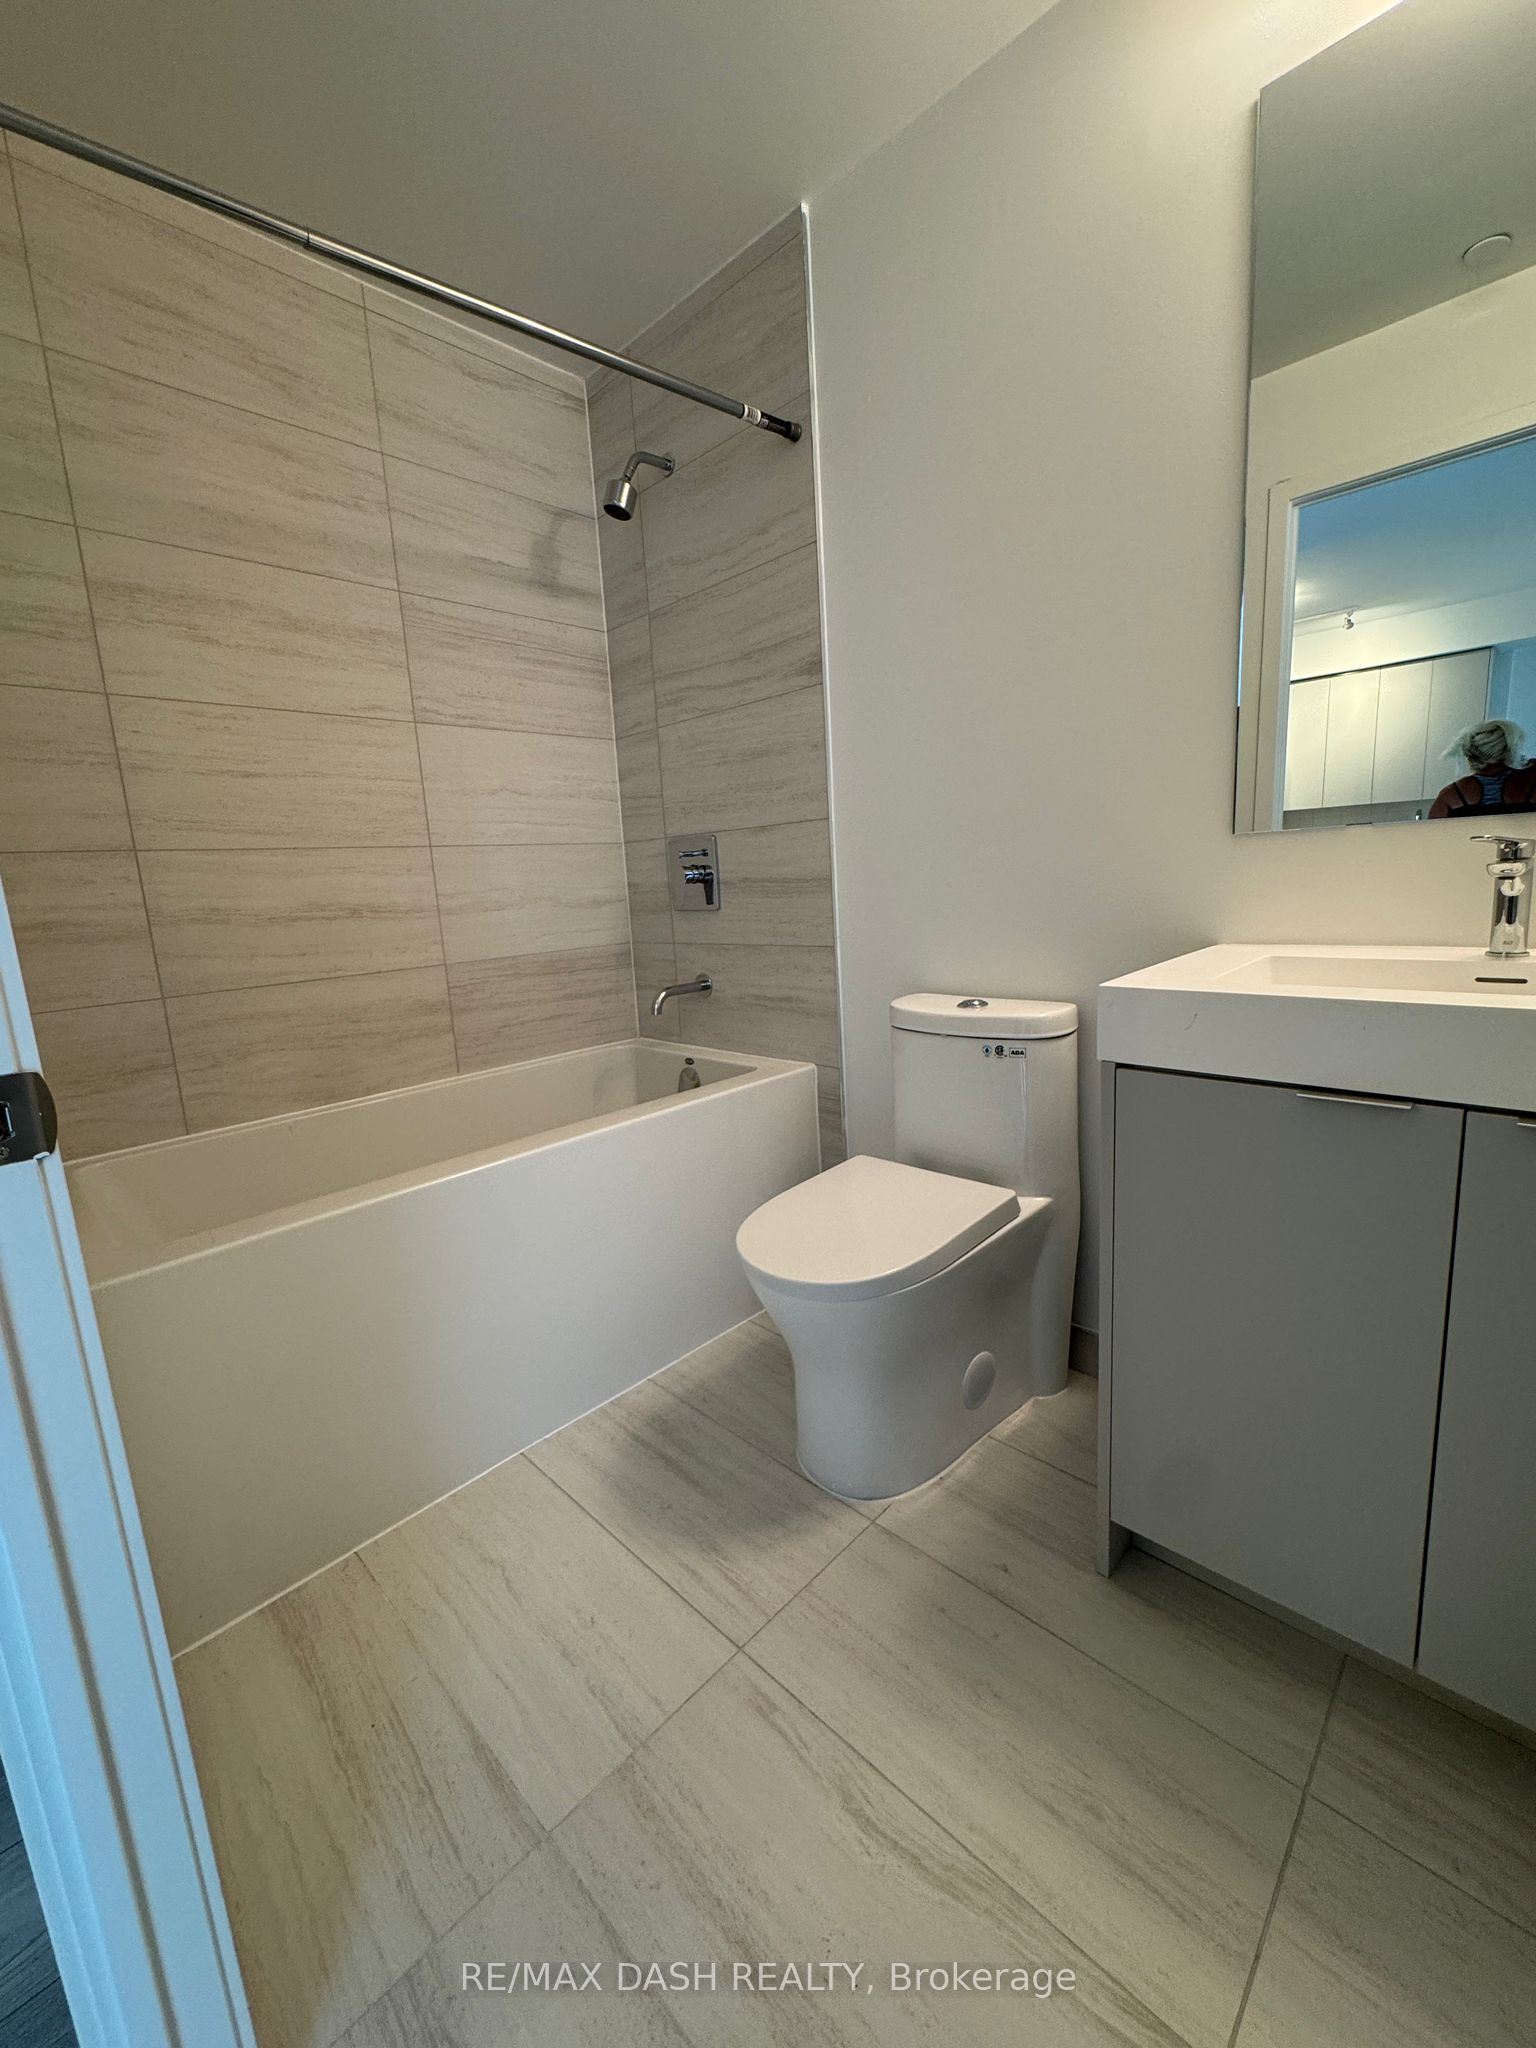
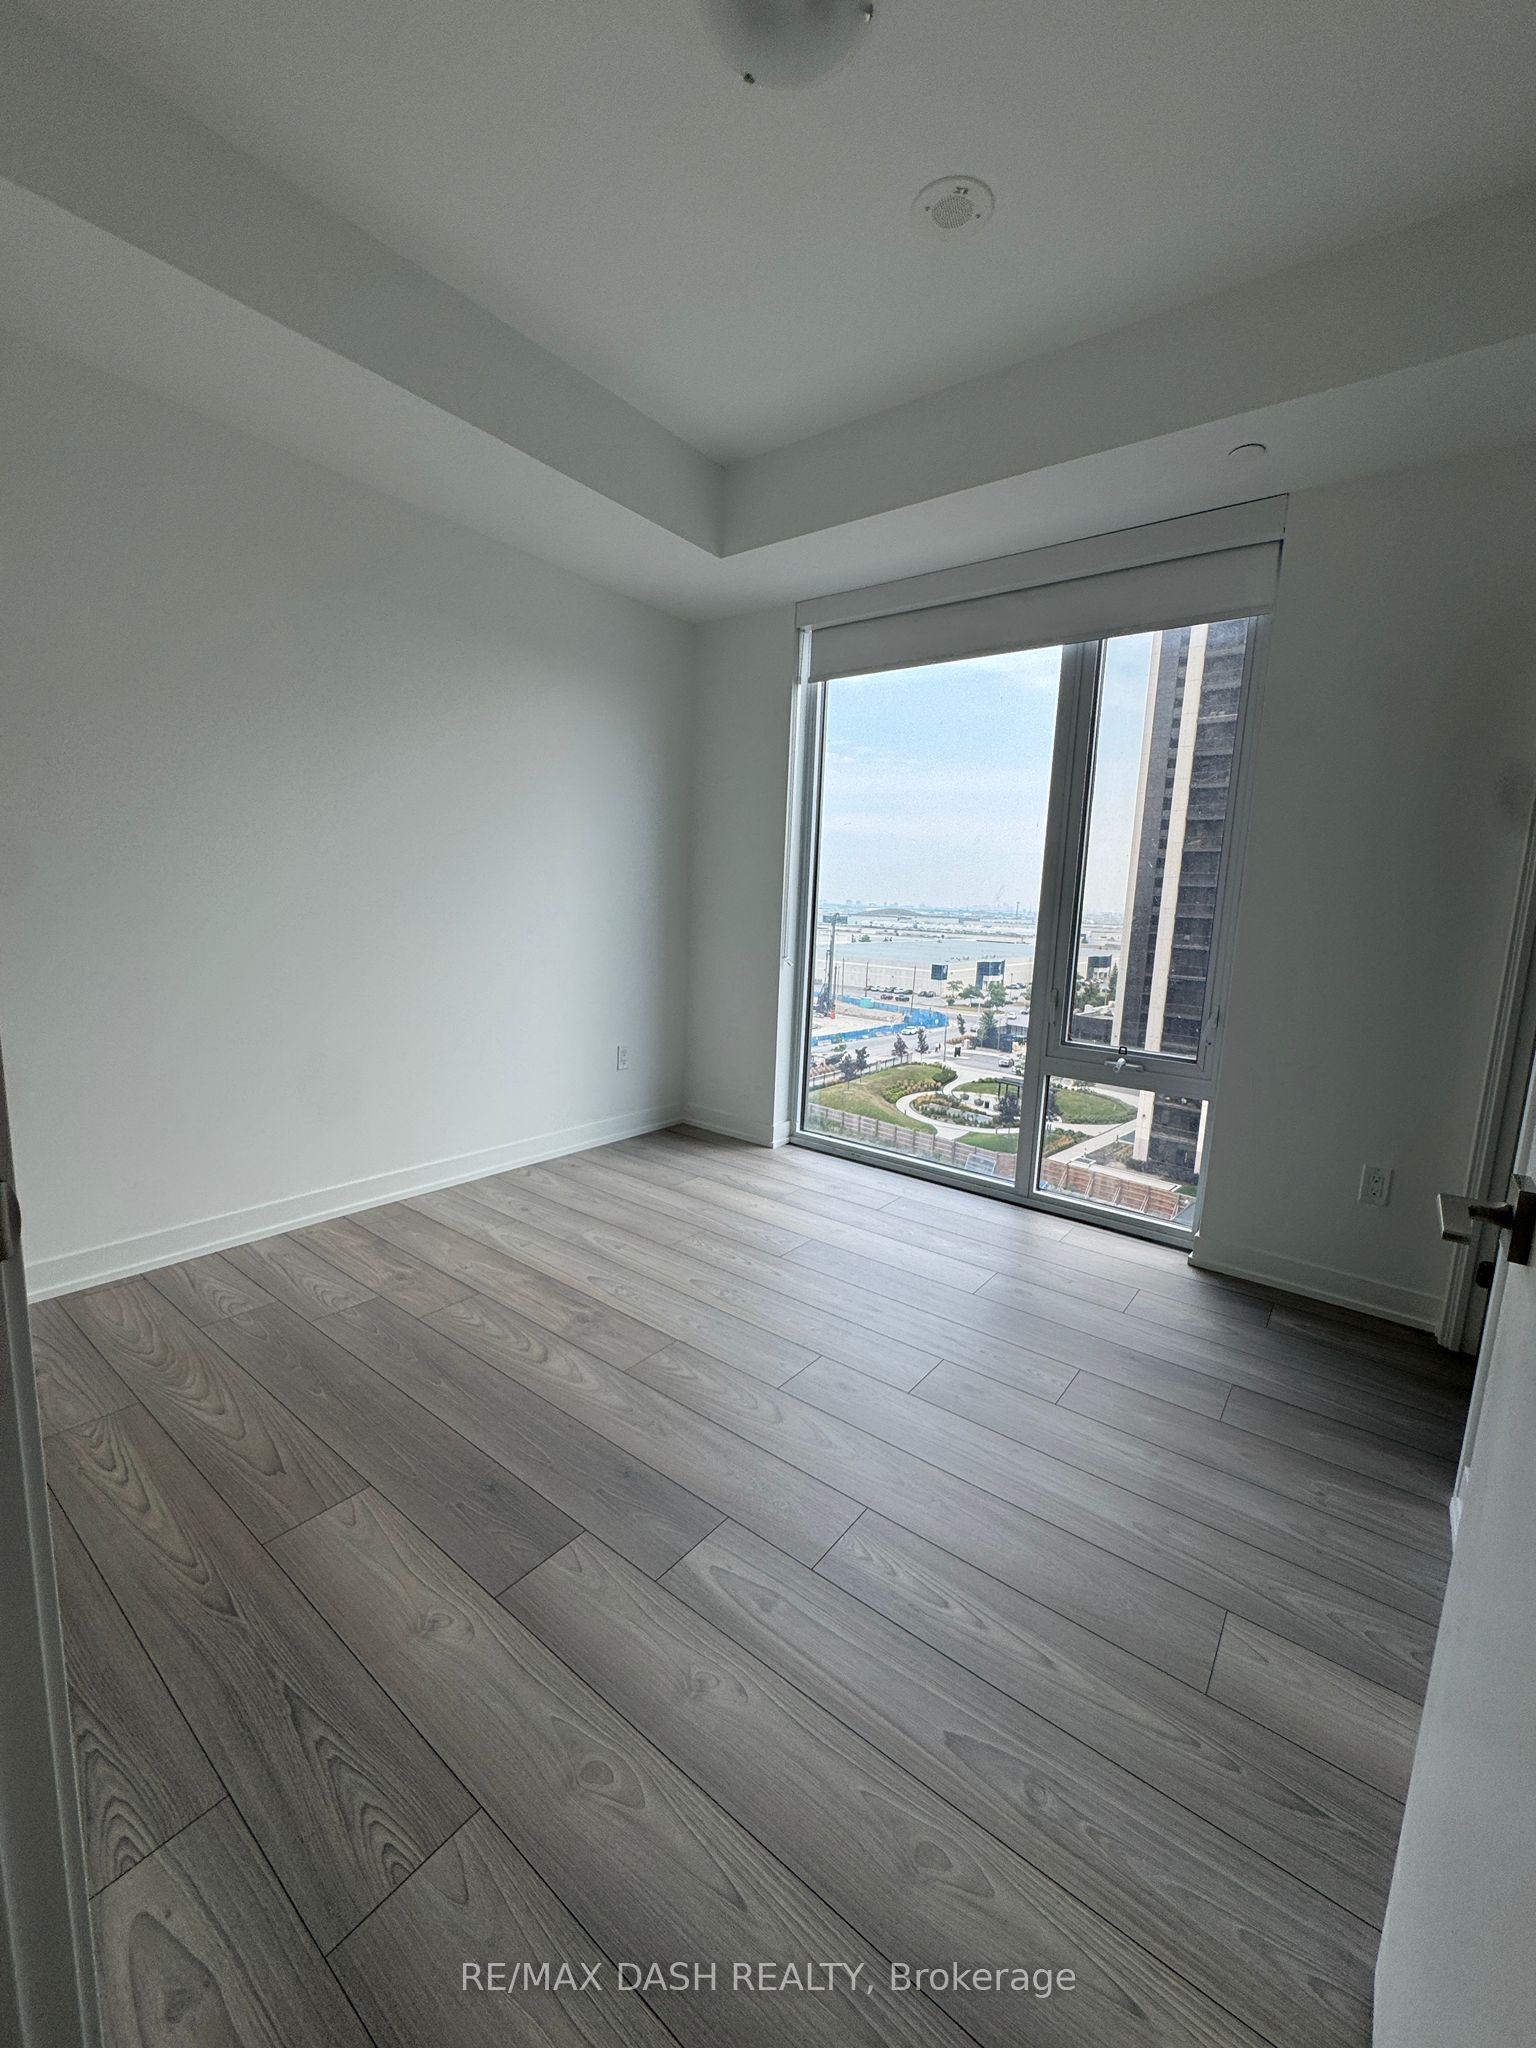
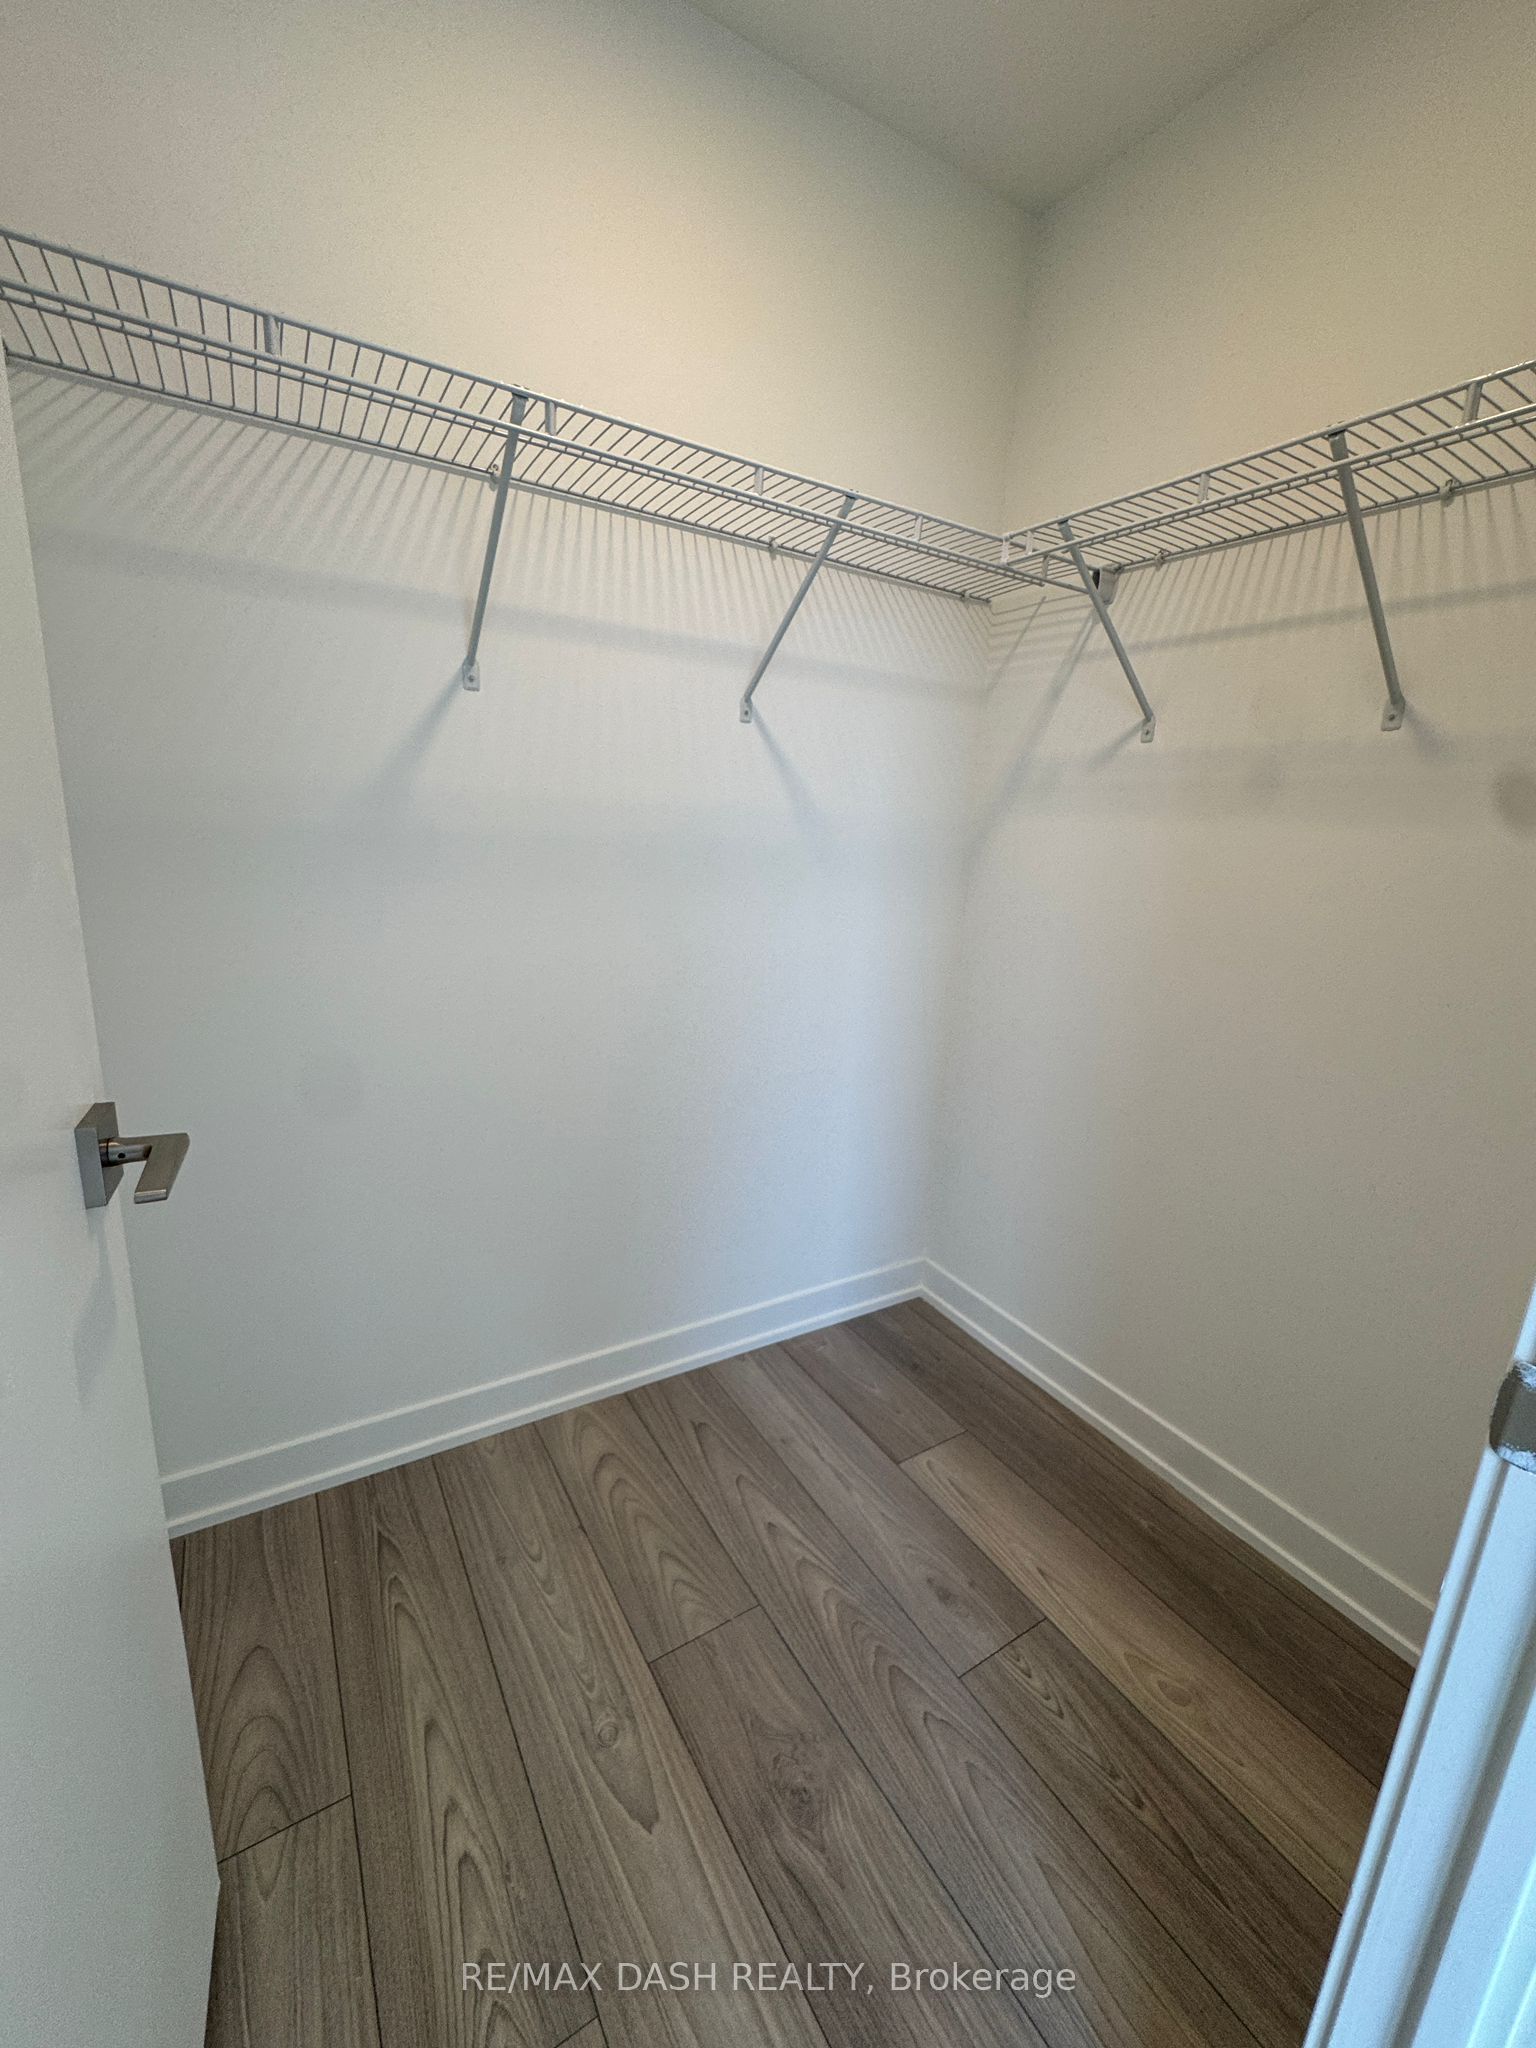
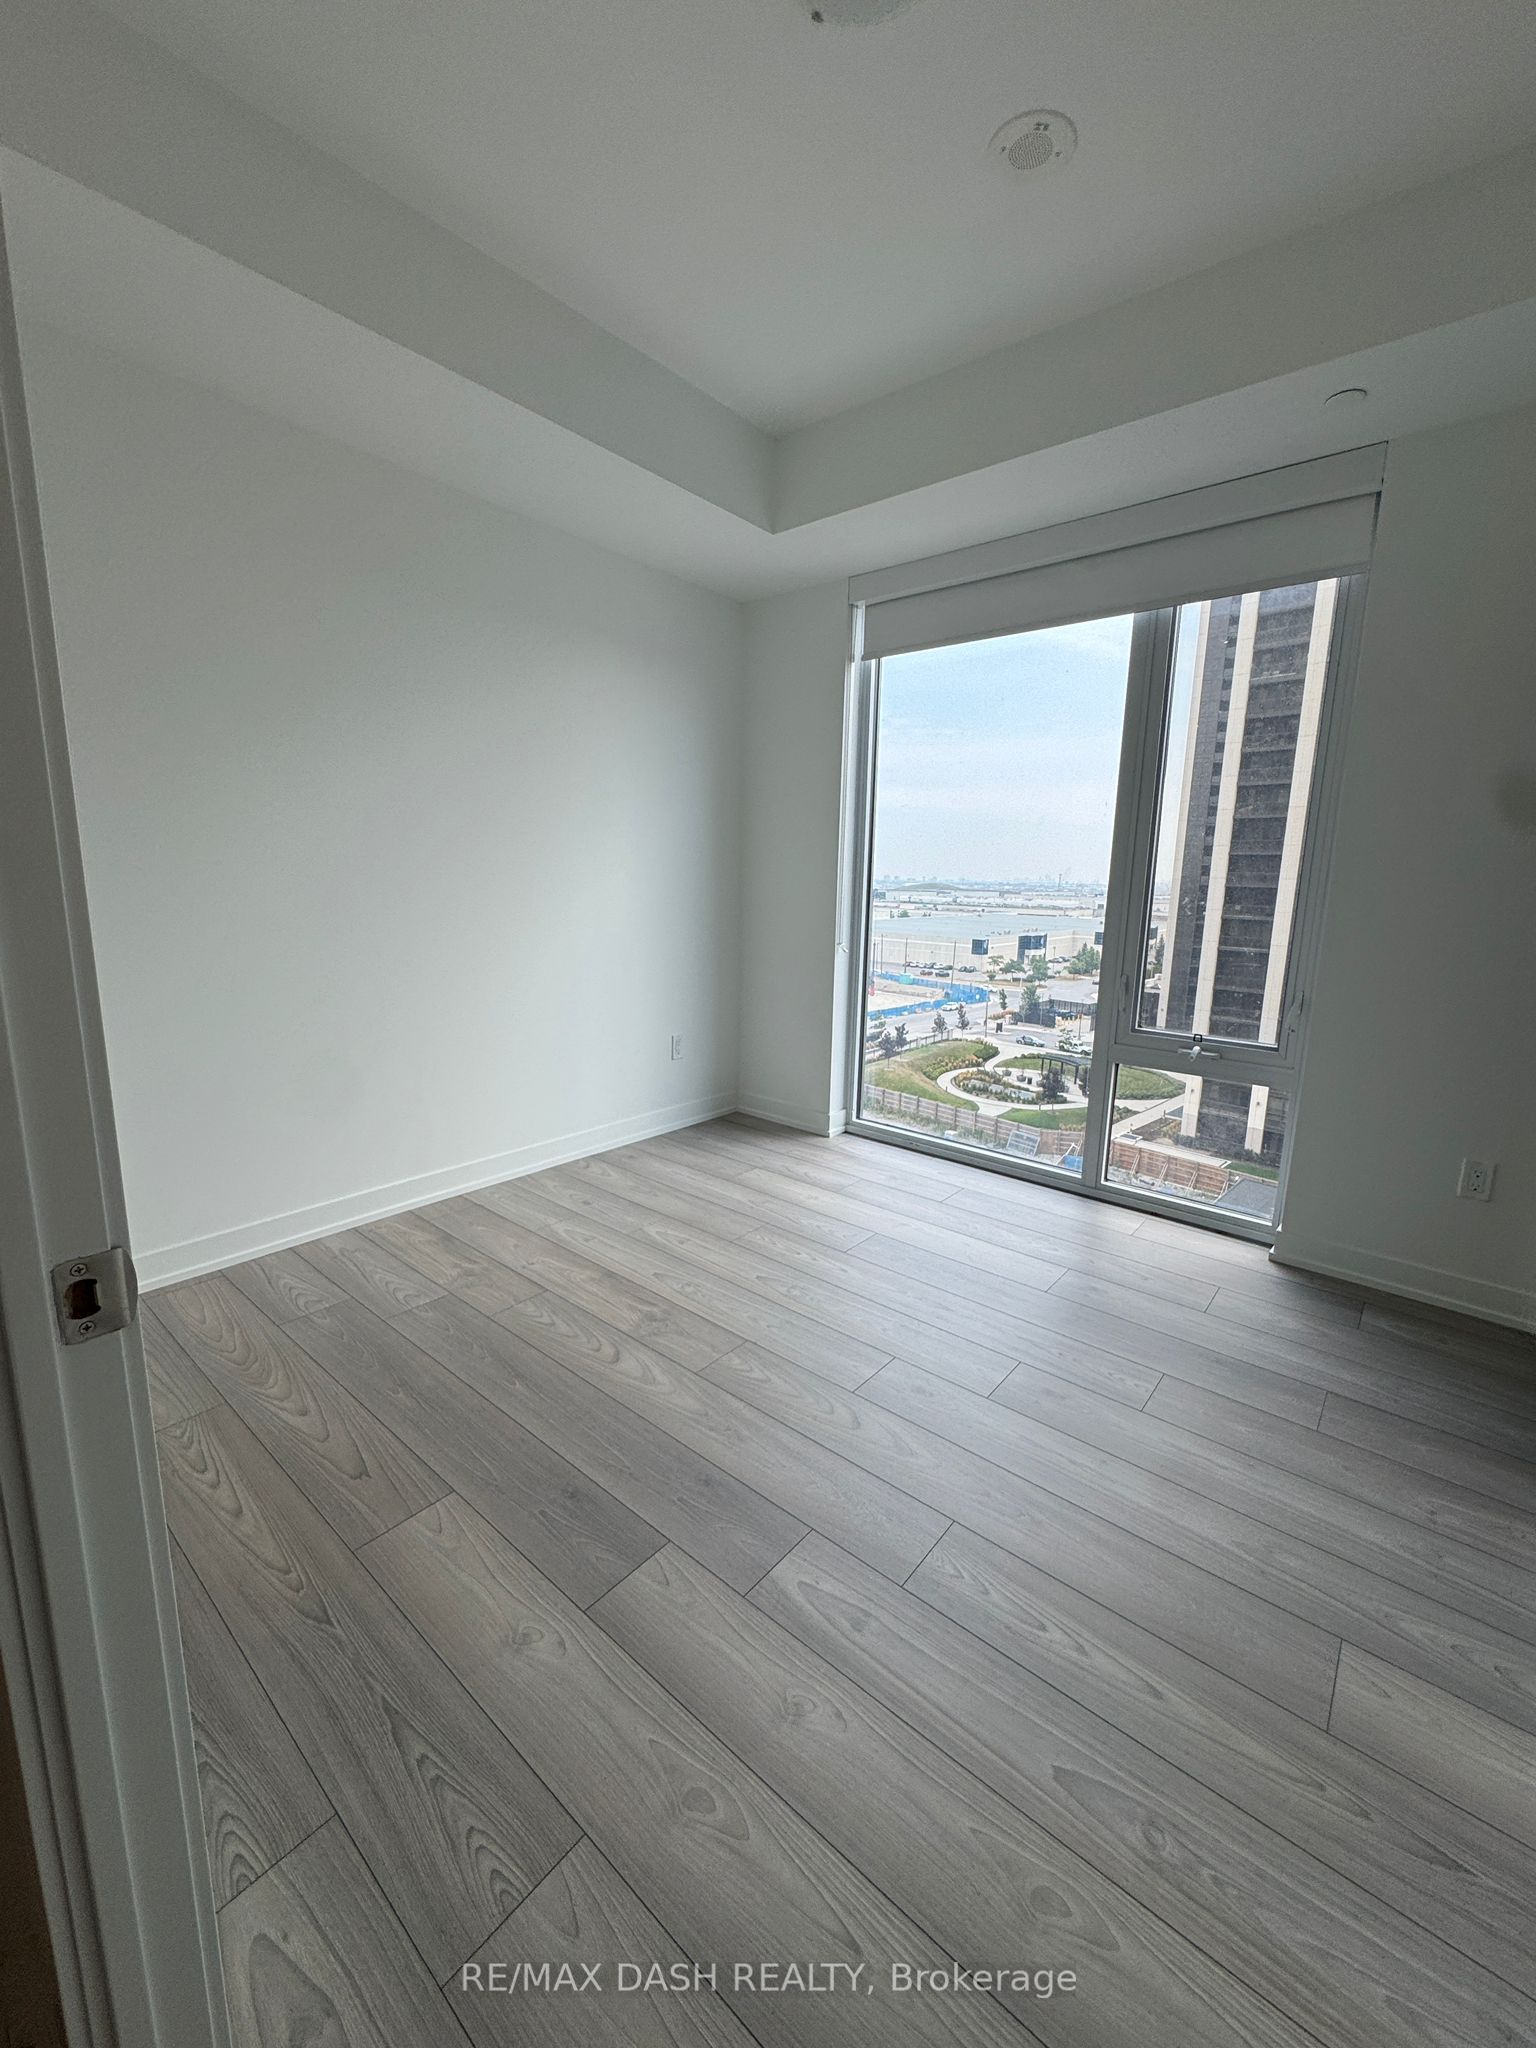
Step Into Luxury With This Never-Lived-In One-Bedroom Suite Featuring A Smart, Functional Layout And High-End Finishes Throughout. Enjoy Spacious Living, Modern Design, And Breathtaking Views That Make Every Day Feel Extraordinary. This Is Urban Living At Its Finest. Don't Miss Your Chance To Call It Home!
Step Into Luxury With This Never-Lived-In One-Bedroom Suite Featuring A Smart, Functional Layout And High-End Finishes Throughout. Enjoy Spacious Living, Modern Design, And Breathtaking Views That Make Every Day Feel Extraordinary. This Is Urban Living At Its Finest. Don't Miss Your Chance To Call It Home!
See MoreKey Info
- Apartment Condo
- No Parking
- Jane & Rutherford
- 500-599 Approximate Sq Feet
- Newly Built
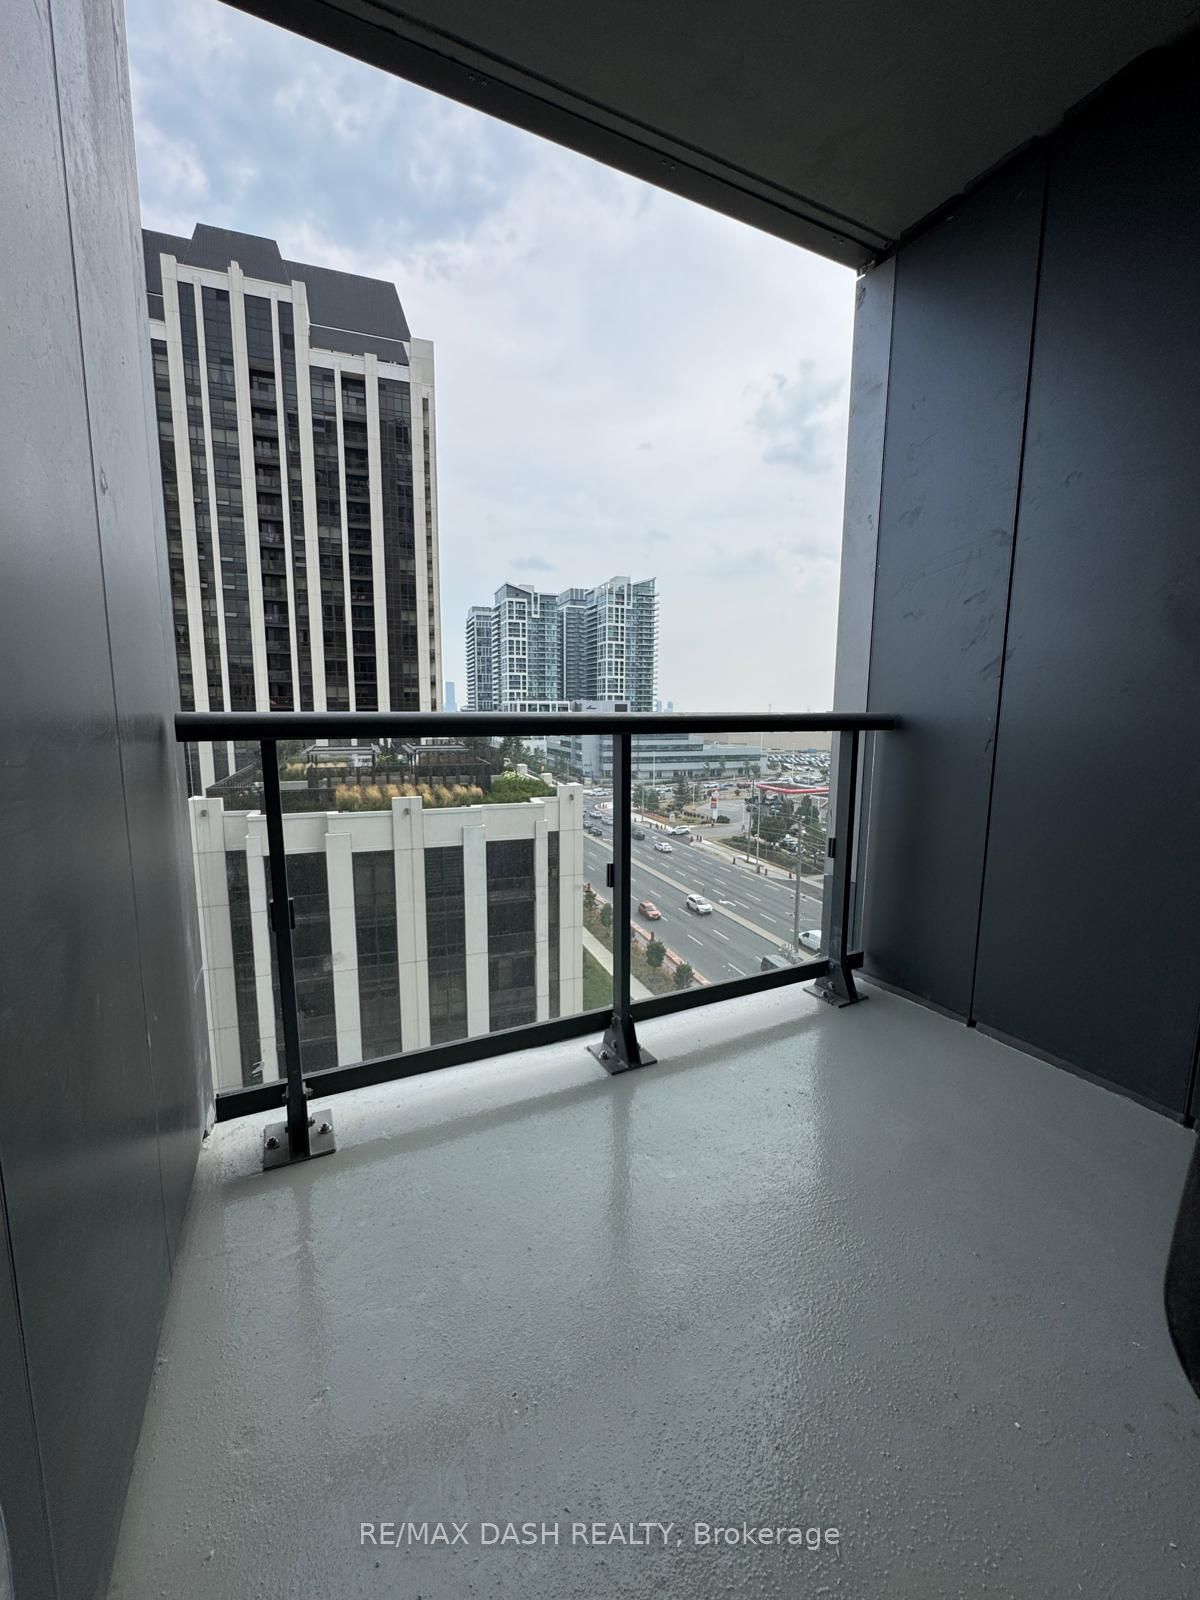
- South Exposure
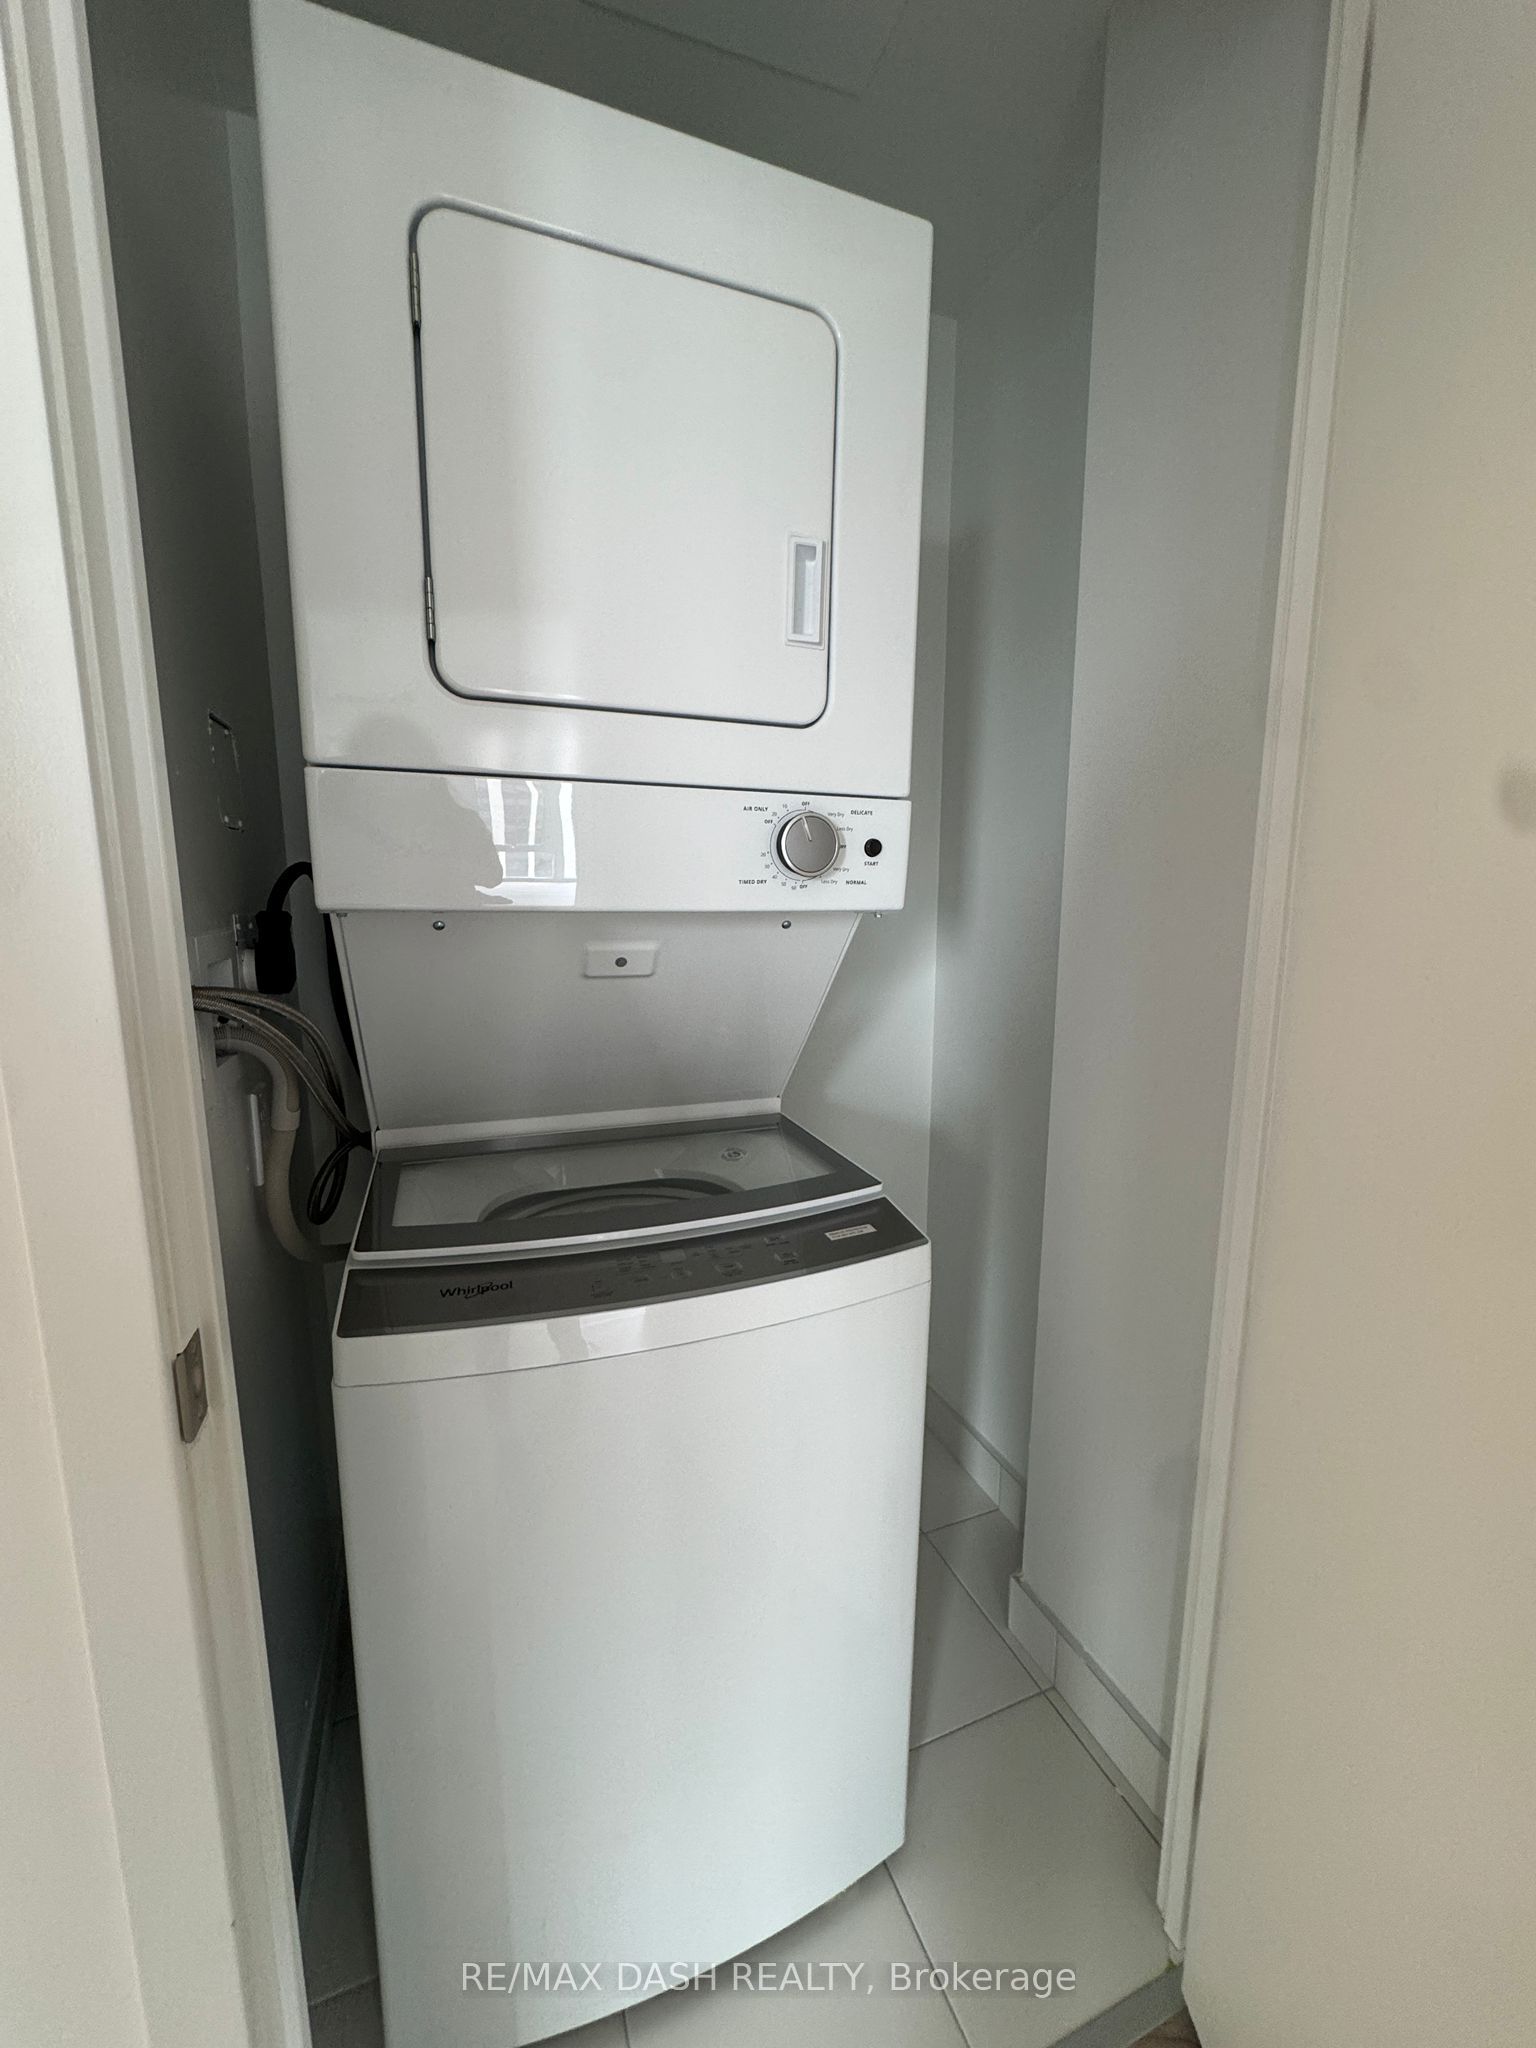
- Ensuite Laundry
- No Locker
- Forced Air Gas Heating
- Central Air
Property
- Excludes: Heat, Hydro, Water, Cable TV, Central A/C, Common Elements, Building Insurance, Parking
- Amenities: Concierge, Gym, Sauna
- Possession: VAC
Details
- No Fireplace
- 1 Kitchen
- Condo Corporation #1574
- Condo Registry Office: YRSCC
- MLS #N12392047
- RE/MAX DASH REALTY
Extras
Rooms
| Room | Floor | Dimensions | Details | |
|---|---|---|---|---|
| 1 | Kitchen | Flat | 11.38' x 9.06' | Stainless Steel Appliances, Quartz Counter |
 | 1 4-Piece Bathroom | |||
How Far is Too Far?
See personalized commute details for each listing by adding your favourite places (like work or daycare) and mode of travel.
Sign up to see commute timesAlready signed up? Sign in
Who lives here?
Concord, Vaughan is a north GTA neighbourhood notable for its singles, renters, executives, salespeople and tradespeople. It has a higher than average population of immigrants, particularly those from Italy and India, and Russian speakers. Residents tend to be older with a significant number of youth aged 20 to 24 and adults aged 25 to 34, 25 to 34, 25 to 34 and 25 to 34.
Families
Kids Per Family
1.2
kids per family
in the neighbourhood.
Gta ({{ '1.29999995231628' | number: 1 }})
Singles
41%
of residents are
single and loving it.
41% singles
Vaughan (39%)Gta ({{ '44.8800010681152' | number: 0 }}%)
Renters
29%
of residents
are renters.
29% renters
Vaughan (11%)Gta ({{ '33.0200004577637' | number: 0 }}%)
Education
40%
of residents are
university grads.
40% university grads
Vaughan (44%)Gta ({{ '43.6699981689453' | number: 0 }}%)
Income
Average Household Income
$131K
is the average household
income in the neighbourhood.
Gta ({{ '135056.828125' | minifiedCurrency }})
Professions
Professions
| Sales | 15% |
| Business | 12% |
| Management | 10% |
| Trades | 10% |
| Sciences | 6% |
Immigrants
54%
of residents were
born outside of Canada.
54% immigrants
Vaughan (48%)Gta ({{ '45.4300003051758' | number: 0 }}%)
Birthplace - All
7.3% from Italy
All-time
Birthplace - Recent
3.0% from India
Recent
Foreign Languages
Foreign Languages
| Italian | 11% |
| Russian | 8% |
| Persian | 4% |
| Mandarin | 4% |
| Gujarati | 3% |
Religions
Religions
| Christian | 62% |
| Jewish | 19% |
| Hindu | 6% |
| Muslim | 1% |
| Buddhist | 1% |